HOT TOPICS LIST
- Strategies
- Stocks
- Buy
- Investing
- Brokers
- Psychology
- Interviews
- Accumulate
- Sell
- Hold
- Spotlight
- Websites
- Candlestick Corner
- Gold & Metals
- Options Trading
LIST OF TOPICS
THE CHARTIST
Gann's 50% Rule
09/24/02 04:14:58 PM PSTby Dennis D. Peterson
Gain useful insight by implementing a straightforward rule.
Much has been written about William D. Gann because he was successful. The detractions come when people discover he employed astrology and psychology as well as other, less controversial techniques to make some of his decisions. If you ignore the astrology and psychology he used, then you'll have a hard time arguing with some of his other ideas, such as his 50% rule. To paraphrase the rule from Gann's How To Make Profits In Commodities:
· The 50% point of reaction to the downside is a point of support. It is the halfway point of range fluctuation. · Buy and sell a trend after the trend is confirmed. · The next most important point is 75% for tops or bottoms, and 100% is the last most important point.
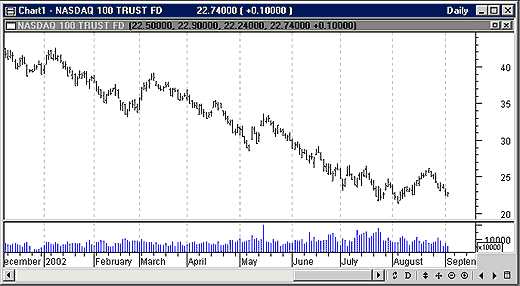
THE ANALYSISTo see how this rule works, let's look at the Nasdaq 100 tracking index (QQQ) in Figure 1. I am going to start with a chart that has annotations and lead you through the analysis. Don't worry if you look at a chart like this and all you see at first is a bunch of price bars with no apparent rhyme or reason.
Figure 1: Daily QQQ price and volume. QQQ has been in a downtrend for the last nine months. To analyze the price action further, it is helpful to identify pivots and swings and examine how retracements occur.
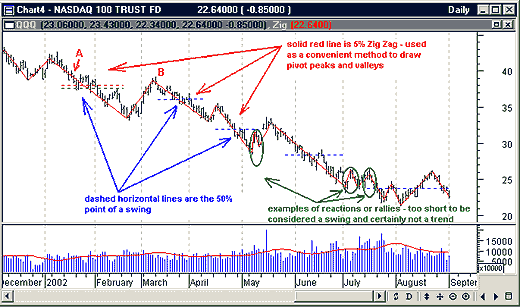
The first thing you may notice is that price is higher in the left-hand portion of the chart than in the lower right-hand corner. It is therefore reasonable to assume that this stock has been in a downtrend. Gann's 50% rule will help determine if a trend is developing. This one example should not be enough to convince you of the efficacy of the method, but you should be able to apply it and come to your own conclusions. My guess is that you will become a Gann fan. The span of this downtrend is about 10 months. Time frames shorter than two months tend to be indicative of a price swing rather than a price trend. Swings and trends are traded differently, and work best with different indicators. For example, a lot of analysis has been done with candlestick patterns, but candlestick patterns are predominantly two- and three-day patterns, with two-day patterns being much more frequent. You can't confirm a trend with a two- or three-day pattern. You might be able to confirm a change in swing direction, given you define a swing to be five to seven price bars. The first step in the analysis is to recognize that the market is a noisy place; you must decide how big a change is worth noticing. What I would like to do (but haven't found the tool to do so yet) is to chart two- or three-day changes as a single bar. Instead, we have to settle for charting daily, weekly, or monthly time frames. Why would two or three days be useful? First of all, two- and three-day patterns are used extensively with candlestick analysis. Second, it would remove noise from the key third-day reversal pattern. Finally, Gann himself plotted two or three days as a single price bar. Here we will settle for pivots defined as a 5% change in price. Since pivots are turning points and a 5% change in price is significant, seeing how these price changes are connected should be useful. Using swings, which I prefer to be seven bars or more in duration, you should look to see how far a subsequent reaction (corrective movement against an upswing or uptrend) or rally (corrective movement against a downswing or downtrend) reaches relative to the 50% point. Using only what is shown here, the first swing is labeled as A (Figure 2) and is a downswing, and the rally is pivot point B (Figure 2). So far, this is not a downtrend: you have a downtrend if rallies fail and you have continued downswings. This downswing (Figure 2: line A) has 30+ bars in it. That length alone spells downward strength. The rally, pivot point B, exceeds the green dashed line, so it seems we might be in for the start of an uptrend. As always, however, you must exercise caution and judgment. The green dashed midpoint line was calculated by taking the closes of the two bars identified as the pivot peak and valley. If you were to use the highest high at the point of the pivot peak, you would get the red dashed line as the midpoint, and the market would be turning just about where you might have predicted.
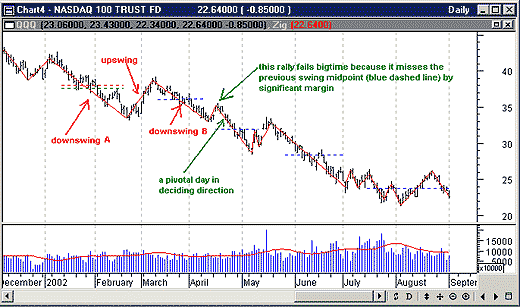
Figure 2: Daily QQQ price and volume. The 5% price changes are identified using zigzag (solid red lines), while dashed red, green, and blue lines identify points of 50% change. Volume has a 20-period triangular average overlay (solid red line). The 50% change lines are only drawn through the zigzag lines that are seven bars or longer. Shorter lengths are either reactions or rallies. To use the 50% rule, see how close the reaction or rally (pivot point B) that follows a swing (labeled as A) comes to the 50% (midway) point of the preceding swing. Volume will also play a role when we look at the strength of rallies and reactions. Before moving forward you should note the volume action in Figure 2. I have used a 20-day triangular average to lessen the noise. A simple moving average might work as well. You want to look for moves on volume that is higher or lower than average. For example, the rallies in the beginning and end of July are weak, because there was noticeably less than average volume supporting them. The upswing in the first half of August also has less than average volume. All of this says that the market's current comfort zone is around 22. While this might be an interesting prediction, it is a bit of a digression; the item to note is whether volume supports a given move, eventually leading to the setup conditions for the trade. Having recognized downswing A and pivot B (Figure 2), you are waiting to see what will develop. It does look like prices are headed down. But now, using Gann's 50% rule, you can anticipate some events that give evidence of what the market is really doing, not just what the pundits are guessing it will. In mid-March you are waiting to see if the current movement down (Figure 3: downswing B) is simply a reaction to the upswing, or if price is going to go right on past the 50% point. In addition, if this turns out to be another downswing, you can expect a subsequent rally to fail. What happens? At the beginning of April, prices move down with average volume — a very sustainable move. The result? Two consecutive downswings. Their length, along with sustainable volume, spells strength. Now you are waiting for the rally, after which you will short.
Figure 3: Daily QQQ price and volume. Two consecutive downswings constitute a downtrend. This rally fails to exceed or even reach the 50% point of the previous downswing B. Between the two downswings prices simply didn't rally, but actually formed an upswing. In late March you are waiting to see if prices fall below the midpoint of the upswing. If they do, you will have two downswings, and prices are now in a downtrend.
What transpires is almost more than you could hope for. On April 16 prices gap up on less than average volume, and gap down on April 22 on less than average volume. If you didn't know better, you might say it looks like a small island reversal — a pattern that suggests, in this context, that prices are headed down. You short on April 23 until you see evidence of the next pivot. Be patient. Gann often mentions the importance of patience when trading the trend. You are not trying to pick the top or bottom, however. This kind of discipline is exactly what all the rules of trading are about.
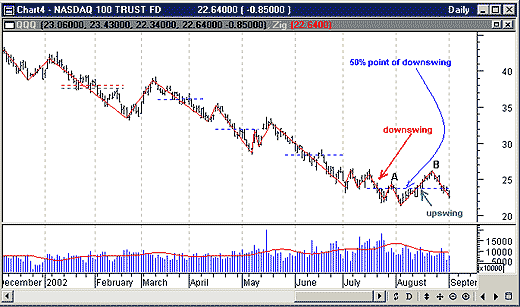
WHERE DO WE STAND TODAY?The downtrend has almost been broken. Note a higher peak (Figure 4: B) than the previous peak (Figure 4: A), but without a valley that is higher than the previous valley. For long positions to set up, you need a second upswing. Then you'll look to go long on the reaction following the second upswing. From a trend standpoint, it is discouraging to see prices dip below the 50% point of the latest upswing (Figure 4). Right now, the market doesn't exhibit a clear direction; in fact, it is starting to go sideways.
Figure 4: Daily QQQ price and volume. The last downswing is short, portending weakness for prices continuing on down. The first rally following the downswing failed to break the 50% point, but the second rally turned out to be an upswing and easily exceeded the 50% point. Prices have now dipped slightly below the 50% point of the upswing. Pivot peak B is higher than pivot peak A, which "half-breaks" the trend down. To fully break the downtrend, you need to have a pivot valley higher than the previous valley.
Looking at price movement from July on, you see both failed and successful rallies. Of course, the downtrend has weakened, and this sideways movement is not a typical consolidation pattern. If it were a classical consolidation pattern, with prices bouncing between support and resistance, you would expect prices to continue down. Follow Gann's advice: Be patient. Don't try and guess that this is a bottom. It may well be, but I would like to see evidence of exhaustion. Instead, wait for a trend to develop and then trade that.
SUMMARYWhile the 50% rule is useful, it is even more to your advantage to do the analysis to see how well the rule applies. With any luck you will start looking for move strength and trend development. Recognizing trends inevitably leads to recognizing consolidations. When prices bounce around in consolidations, use accumulation/distribution to get an edge on which way price should break. Use stops to hedge your guesses. Be patient, do your homework, and good luck.
Dennis Peterson may be reached at DPeterson@Traders.com. MetaStock (Equis International)
Current and past articles from Working Money, The Investors' Magazine, can be found at Working-Money.com. |
Market index trading on a daily basis.
| Title: | Staff Writer |
| Company: | Technical Analysis, Inc. |
| Address: | 4757 California Ave SW |
| Seattle, WA 98116-4499 | |
| Phone # for sales: | 206 938 0570 |
| Fax: | 206 938 1307 |
| Website: | working-money.com |
| E-mail address: | dpeterson@traders.com |
Traders' Resource Links | |
| Charting the Stock Market: The Wyckoff Method -- Books | |
| Working-Money.com -- Online Trading Services | |
| Traders.com Advantage -- Online Trading Services | |
| Technical Analysis of Stocks & Commodities -- Publications and Newsletters | |
| Working Money, at Working-Money.com -- Publications and Newsletters | |
| Traders.com Advantage -- Publications and Newsletters | |
| Professional Traders Starter Kit -- Software | |
PRINT THIS ARTICLE

Request Information From Our Sponsors
- StockCharts.com, Inc.
- Candle Patterns
- Candlestick Charting Explained
- Intermarket Technical Analysis
- John Murphy on Chart Analysis
- John Murphy's Chart Pattern Recognition
- John Murphy's Market Message
- MurphyExplainsMarketAnalysis-Intermarket Analysis
- MurphyExplainsMarketAnalysis-Visual Analysis
- StockCharts.com
- Technical Analysis of the Financial Markets
- The Visual Investor
- VectorVest, Inc.
- Executive Premier Workshop
- One-Day Options Course
- OptionsPro
- Retirement Income Workshop
- Sure-Fire Trading Systems (VectorVest, Inc.)
- Trading as a Business Workshop
- VectorVest 7 EOD
- VectorVest 7 RealTime/IntraDay
- VectorVest AutoTester
- VectorVest Educational Services
- VectorVest OnLine
- VectorVest Options Analyzer
- VectorVest ProGraphics v6.0
- VectorVest ProTrader 7
- VectorVest RealTime Derby Tool
- VectorVest Simulator
- VectorVest Variator
- VectorVest Watchdog


