HOT TOPICS LIST
- Strategies
- Stocks
- Buy
- Investing
- Brokers
- Psychology
- Interviews
- Accumulate
- Sell
- Hold
- Spotlight
- Websites
- Candlestick Corner
- Gold & Metals
- Options Trading
LIST OF TOPICS
THE CHARTIST
LRS + R-Squared = The 95% Solution
10/08/02 02:35:00 PM PSTby Rudy Teseo
No, this has nothing to do with Sherlock Holmes. It has a lot to do with the linear regression slope, r-squared, and how combined they can tell you whether the trend is strong.
| Most indicators signal whether a stock is becoming (or behaving) bullish or bearish. They do not, however, opine how reliable the indication is, nor how strong the trend might be. How about an indicator that gives a 95% probability that the trend is a strong one, provided that the parameters are met?
IMPORTANCE OF SLOPEThe linear regression method provides several useful outputs for technical analysis, one of which is slope. The slope shows how much prices are expected to change per unit of time — that is, how quickly prices may change. A steep slope indicates a fast rate of change. A shallow slope indicates a slow rate of change. When the slope of the trend first becomes significantly positive, you could open a long position with some assurance that the trend will continue. When the slope first becomes significantly negative, you could close your long position, or open a short position, for similar reasons. However, while slope gives you the direction of the trend (whether positive or negative), like many other indicators it gives no measure of how strong the trend is. It is helpful, therefore, to consider slope in relation to r-squared, which indicates the strength of the trend. A high r-squared value, combined with a high positive or negative slope, gives you some confidence that a strong trend is developing.
R-SQUAREDAlthough it is useful to know the r-squared value, ideally, you should use r-squared in tandem with slope. High r-squared values accompanied by a small slope may not interest short-term traders. However, high r-squared values accompanied by a large slope value may be of great interest. The r-squared indicator can be used successfully as a confirming indicator. Momentum-based indicators such as stochastics, relative strength index (RSI), commodity channel index (CCI), and so on and moving average systems require trend confirmation in order to be considered reliable. R-squared provides a means of quantifying the strength of price trends. If r-squared is above its critical value and heading up, you can be 95% confident that a strong trend is present. When using momentum-based indicators, you should only trade overbought/oversold levels if you have determined that prices are trendless or weakening (that is, prices have a low or lowering r-squared value). Be aware that in a strongly trending market, prices can remain overbought or oversold for extended periods. Therefore, you may want to review any trading systems that depend strictly on overbought/oversold levels, and consider adding the LRS/r-squared indicators.
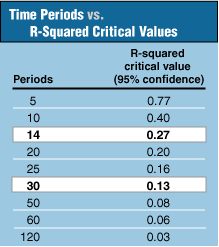
HOW DO YOU USE IT?Figure 1 shows the value of r-squared used to determine when a trend is significant. This table shows the values of r-squared required for a 95% confidence level at various time periods. For example, if the 14-period slope has recently turned from negative to positive (that is, it has crossed above zero), you may consider buying when r-squared crosses above the 0.27 level. To determine if the trend is statistically significant for a given x-period linear regression line, plot the r-squared indicator for the same time period and refer to the table. If the value is smaller than the critical values shown, you should assume that prices show no statistically significant trend.
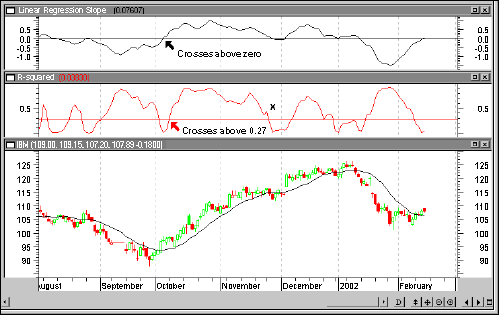
Figure 1: R-squared. Here you see values used to determine when a trend is considered significant. I've highlighted the 14- and 30-day periods, which I will be demonstrating. (To calculate the critical value for any time period, see the sidebar, "R-squared parameters.") The period refers to whatever time period you are using in your chart analysis. If you are plotting daily charts, your period will be in days. If you are plotting weekly data, your period will be in weeks. The parameters for the linear regression slope are the number of time periods to use when calculating the indicator and the price field (that is, the open, high, low, close, or even an average such as (H+L)/2). The parameter for r-squared is merely the time period, which, of course, must match the slope. You may consider opening a short-term position opposite the prevailing trend when you observe the slope rounding off at extreme levels. For example, if the slope is at a relatively high level and begins to turn down, you may consider closing your long position or opening a short position. You may consider opening a short-term position opposite the prevailing trend when you observe r-squared rounding off at extreme levels. For example, if the slope is positive and r-squared is above 0.80 but begins to turn down, you may consider selling or opening a short position. Figure 2, a chart of IBM, is overlaid with a 14-day moving average. The arrows show the slope crossing above zero and r-squared crossing above the 0.27 threshold. This pattern augured well for the sustained uptrend, which lasted approximately three months. No system is infallible, however; there will always be false signals. Note at point X that some money management decision would have to be made. If you had a mechanical system that closed your long position on a fixed percentage decline in price, then you might have cut your profit short. If you were monitoring the price using your favorite indicators for confirmation and no sell signal was given, you might have gotten past the glitch. Note also in January that the slope crossed below the zero threshold, signifying a downtrend. This was followed by r-squared crossing above its threshold at a steep angle, signifying a strong trend (it works in either direction). IBM fell close to 20% in two weeks.
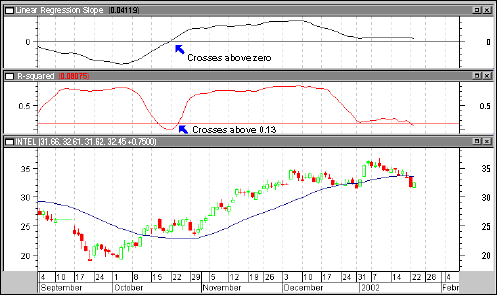
Figure 2: 14-period LRS/r-squared indicators. Notice price action when the threshold levels are crossed. In Figure 3 you see a chart of Intel (INTC) with a 30-day moving average displayed. Again, the arrows show the indicators crossing above zero and the 0.13 threshold. This pattern presaged a nice uptrend that lasted approximately three and a half months with a 40% gain.
Figure 3: 30-period LRS/r-squared indicators. You could have made a 40% gain during a period of three and a half months. While these charts show a nice trend following the confirmation of the slope/r-squared combination, it would be tiresome to have to scroll through your portfolio to find these chart patterns. Instead, you want to set up a search for those stocks that exhibit the patterns. The following is an example that uses MetaStock's Explore function. Similar searches can be set up in many other programs, such as TradeStation, AIQ TradingExpert Pro, and TC2000. The Explore function in MetaStock allows seven columns of parameters, along with a filter that sets the logic for the search. I based my search on the closing price to set up the following exploration. The logic for the 14-period search is:
ColA: Close ColB: LinRegSlope(C,14) ColC: Rsquared(C,14) ColD: Ref(Rsquared(C,14),-1) Filter: ColB>0 AND ColC>0.27 AND ColC>ColD
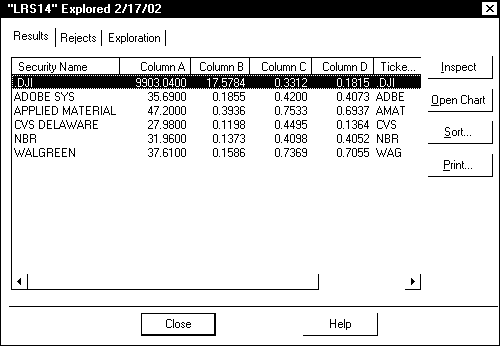
The logic for the 30-day search is the same, except substituting 30 for 14, and 0.13 for 0.27. Figure 4 is a screenshot of a 14-day exploration. Out of a list of 37, only these stocks met the parameters of the filter. ColA shows the closing price on the date of exploration, ColB shows the slope values (all above zero), ColC shows the value of r-squared (all above 0.27), and ColD shows yesterday's r-squared value. The filter removes any stock from the list whose r-squared value is less than yesterday's. The remaining stocks are the ones to check to see if your favorite indicators confirm the LRS/r-squared indicators. A quick comparison of ColD versus ColC gives you a heads-up of which stock's r-squared has increased the most in one day (for example, CVS).
Figure 4: Results of a 14-period LRS/r-squared exploration. Note that only a few stocks meet the parameters of the filter. Note that an unusually high r-squared reading (for example, 0.8) might indicate an overbought situation and a possible downturn. If additional oscillators are indicating a downturn, this would not be a good entry signal. Conversely, if r-squared is just crossing above the threshold and other confirming indicators are displaying similar characteristics, it might be a very good buy signal. This technique is discussed in few technical analysis books. Try it on your watchlist and paper trade it until you decide if it's for you.
Rudy Teseo has taught courses in option trading and the basics of stock charting. Contact him at rftess@juno.com.
SUGGESTED READINGTeseo, Rudy [2001]. "Threshold Trading Revisited," Technical Analysis of Stocks & Commodities, Volume 19: December.MetaStock (Equis International)
See our online cumulative glossary.
SIDEBARR-SQUARED PARAMETERS Note that the r-squared parameters are in inverse proportion to the time periods. It is only necessary to remember one time period/critical value combination from which all critical values may be calculated. For example, note that a period of 10 requires a critical value of 0.40. To calculate the critical value for a period of 50, for example, the ratio of 10/50 is 1/5, and 1/5 of 0.40 is 0.08. Round off other calculations to two decimal places.
Current and past articles from Working Money, The Investors' Magazine, can be found at Working-Money.com. |
Rudy Teseo is a private investor who trades stocks, options, and currencies. He has taught classes in technical analysis and option trading. He may be reached at rftess@optonline.net.
| E-mail address: | rftess@optonline.net |
PRINT THIS ARTICLE

Request Information From Our Sponsors
- StockCharts.com, Inc.
- Candle Patterns
- Candlestick Charting Explained
- Intermarket Technical Analysis
- John Murphy on Chart Analysis
- John Murphy's Chart Pattern Recognition
- John Murphy's Market Message
- MurphyExplainsMarketAnalysis-Intermarket Analysis
- MurphyExplainsMarketAnalysis-Visual Analysis
- StockCharts.com
- Technical Analysis of the Financial Markets
- The Visual Investor
- VectorVest, Inc.
- Executive Premier Workshop
- One-Day Options Course
- OptionsPro
- Retirement Income Workshop
- Sure-Fire Trading Systems (VectorVest, Inc.)
- Trading as a Business Workshop
- VectorVest 7 EOD
- VectorVest 7 RealTime/IntraDay
- VectorVest AutoTester
- VectorVest Educational Services
- VectorVest OnLine
- VectorVest Options Analyzer
- VectorVest ProGraphics v6.0
- VectorVest ProTrader 7
- VectorVest RealTime Derby Tool
- VectorVest Simulator
- VectorVest Variator
- VectorVest Watchdog


