HOT TOPICS LIST
- Strategies
- Stocks
- Buy
- Investing
- Brokers
- Psychology
- Interviews
- Accumulate
- Sell
- Hold
- Spotlight
- Websites
- Candlestick Corner
- Gold & Metals
- Options Trading
LIST OF TOPICS
THE CHARTIST
Qualified Chart Patterns
10/22/02 04:06:26 PM PSTby Austin Passamonte
Changing market conditions may mean you should rethink your analysis.
| The art of timing equity trade entries based on simple chart patterns appeared effortless during the boom years of the late 1990s. All you had to do was look for bull flags, pennants, wedges, and coils to break higher, go long, and cash in on impressive gains soon after. How many traders successfully played that approach time after time? Plenty, I would think. Since those days, many traders complain about chart patterns failing to work the way they once did. In fact, more than a few words have been written about failed chart patterns being higher-odds trade entries than confirmed breakouts. Bullish consolidations barely pop higher, only to see price action fall back through. Meanwhile bearish patterns begin to break support, right before a "V" bottom bounce takes off. The assumption is that masses of traders who cut their teeth on continuation patterns not so long ago are now being trapped by deliberate reversals. But trading simple chart patterns should not pose much dilemma. If chart patterns were the only trade entry filter used, we could easily become perplexed. Fortunately, there is an array of simple trading tools to qualify or confirm pending chart patterns that offer trade setups, with directional bias determined long before any breakout ever occurs. These days, buying support, selling resistance, and using oscillators like stochastics seems to work much better than do continuation pattern breaks. Once the masses waited for breakouts before they would jump in, pushing the market as momentum fed on itself. Now a bevy of contrarians seize such moments to squash rallies at resistance or prop dips near support. Why is this happening? A simplified answer may be that momentum traders simply fed the fires, and a majority of them have since retired or switched professions. Fewer traders leads to thinner volume, which in turn creates range-bound markets. But regardless of the reasons for current market behavior, traders should focus on how to handle failed chart patterns.
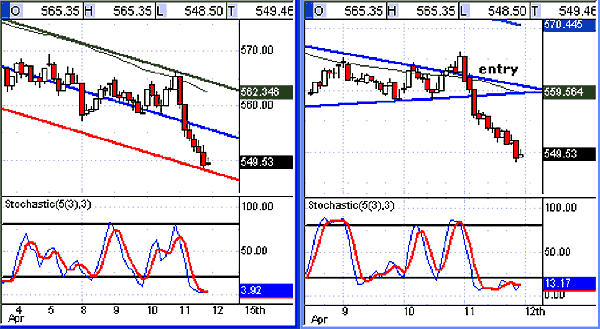
IDENTIFYING PATTERNSIt's important in trading to be able to identify and filter patterns that should work effectively. Knowing how to predict each pattern is paramount to success today, just as in the past (and this will remain true in the future). In the example for short-term action for the Standard & Poor's 100 index (OEX) displayed in Figure 1, you see where price bars wedged up via a 30-minute chart time frame on the right. On the surface, this is a classic case of traders playing the breakout and prospering. But that's just how too many of today's traders may find themselves trapped.
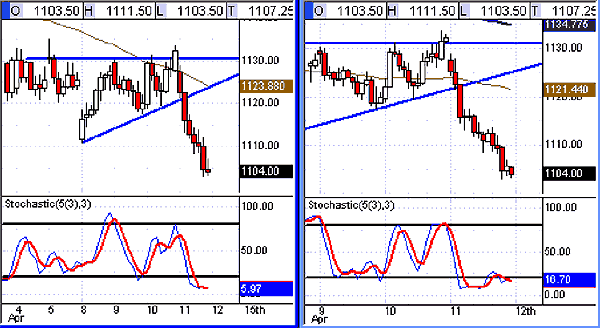
Figure 1: S&P 100 index (OEX). The 60-minute and 30-minute charts can be seen here. Although the chart patterns on the 30-minute chart suggest a breakout, looking at a longer time frame suggests otherwise. Further, the addition of an indicator such as the stochastic oscillator confirms that a top is near. Had you been watching only this single chart in one time frame while playing pattern breakouts alone, a failed bullish trade might have been the result. However, a quick look at another time frame chart, in this case a 60-minute length to confirm, would have shown cause for concern: Price action was clearly trading at the upper range of a defined (and very bearish) descending channel, which is a warning against taking long plays. On top of that, the simple stochastic values were both trading near or at the overbought extreme, a clear warning that these time frames are overbought and upside pressure may be weak at best. When price action trades toward resistance in the midst of a downtrend, you really shouldn't be thinking about entering a long position. You should probably be focusing on your next short play entry instead. Once the upside break fails and falls back through the pattern as expected, short-side entry points would work well. Long put options on this index could have enjoyed potential gains of at least +9.00 index points, and just about any strike of an OEX put option in this example would have fared well also. E-mini index futures traders would have experienced a similar scenario. With classic bullish ascending triangle patterns such as those depicted in Figure 2, you may consider going long. A break outside this pattern confirms the bias and may be an ideal entry point for a long position. But is that the prudent thing to do? Perhaps, but once again take note that the stochastic values are rising to (or are within) overbought extremes on multiple time frames, warning of upward price strength that is petering out. A long entry above the resistance level might be fine, but price may stop below the pattern's upper line. Plans to switch and go short, should price action reverse, are necessary preparation here.
Figure 2: E-mini S&P 500 futures contract. Here you see a scenario similar to that in the previous chart. A short-position entry when prices broke below the support level would have resulted in strong gains.
Fortunately, the stochastic values are in opposition to the bullish triangles. Price action barely broke out before failing miserably for the long positions and performing wildly for the shorts. A long entry near 1131.00 with an arbitrary stop to cover and switch directions near 1127.00 would have resulted in a loss of -4.00 index points, but a gain of +20 points or more on the short trade. Traders trying to rely on chart patterns alone would be blind to the danger of upside weakness and downside risk, as depicted by simple stochastic values added to the picture.
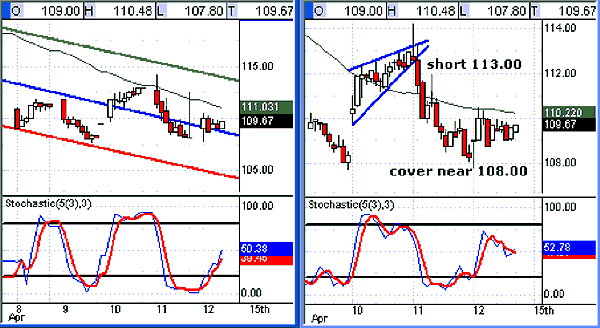
THE BIOTECH INDEXAnother example I have discussed is the biotech sector. Playing the entire index sector using BBH basket shares via the HOLDR (listed on Amex) using actual shares or underlying options is popular and for good reason, as it offers plenty of intraday volatility and movement for scalpers and swing traders alike. Once again, in this snapshot displayed in Figure 3, you see an ascending wedge in the 30-minute chart (right-hand side) suggesting weakness ahead. The 60-minute chart on the left shows price action trading above its recent channel's midline support, but stochastic values are overbought and warn of bearish price action to come. One quick spike to the 114 area off the open may have faked out pure chart pattern players who thought this bearish setup failed, but stochastic values give firm conviction to pending shorts that upside action is not the high-odds move.
Figure 3: The Biotech HOLDRS (BBH). Here you see a fakeout. Stochastic values are in the overbought territory, which should give you a heads-up.
Chart pattern players jumping on the long side of this apparent failed bearish ascending wedge might have thought they just saw the strength of a failed pattern confirmation for a viable long-play entry. However, the stochastic values confirmed bearishness or warned of false bullishness and should have kept you from the breakout fakeout, giving plenty of time to wait for downside action to ensue. Shorting the BBH below recent support at 112 or so would have been good for several points for an intraday trade and possibly for a longer time frame.
SUMMATIONTrading chart patterns as they break has worked in all markets in the past, and will work in the future. Although trading based on chart patterns alone can prove to be useful, the addition of a few simple market timing tools can help keep you on the profitable side of market direction.
Austin Passamonte has followed and traded futures, stocks, and equity options markets since 1984. Currently, he is the founder and editor of CoiledMarkets.com, a trader's advisory and educational website service. He may be reached at austinp@coiledmarkets.com.
Current and past articles from Working Money, The Investors' Magazine, can be found at Working-Money.com.
|
Austin Passamonte is a full-time professional trader who specializes in emini stock index futures, forex, and commodity markets. His trading approach uses proprietary chart patterns found on an intraday basis. To find out more about Passamonte's work, visit www.coiledmarkets.com.
| Website: | www.CoiledMarkets.com |
| E-mail address: | austinp@coiledmarkets.com |
PRINT THIS ARTICLE

Request Information From Our Sponsors
- StockCharts.com, Inc.
- Candle Patterns
- Candlestick Charting Explained
- Intermarket Technical Analysis
- John Murphy on Chart Analysis
- John Murphy's Chart Pattern Recognition
- John Murphy's Market Message
- MurphyExplainsMarketAnalysis-Intermarket Analysis
- MurphyExplainsMarketAnalysis-Visual Analysis
- StockCharts.com
- Technical Analysis of the Financial Markets
- The Visual Investor
- VectorVest, Inc.
- Executive Premier Workshop
- One-Day Options Course
- OptionsPro
- Retirement Income Workshop
- Sure-Fire Trading Systems (VectorVest, Inc.)
- Trading as a Business Workshop
- VectorVest 7 EOD
- VectorVest 7 RealTime/IntraDay
- VectorVest AutoTester
- VectorVest Educational Services
- VectorVest OnLine
- VectorVest Options Analyzer
- VectorVest ProGraphics v6.0
- VectorVest ProTrader 7
- VectorVest RealTime Derby Tool
- VectorVest Simulator
- VectorVest Variator
- VectorVest Watchdog


