HOT TOPICS LIST
- Strategies
- Stocks
- Buy
- Investing
- Brokers
- Psychology
- Interviews
- Accumulate
- Sell
- Hold
- Spotlight
- Websites
- Candlestick Corner
- Gold & Metals
- Options Trading
LIST OF TOPICS
THE CHARTIST
Trading Systems Using Multiple Indicators
11/05/02 01:47:21 PM PSTby Dennis D. Peterson
Two indicators are better than one.
| Trading systems that use two or more indicators do better than systems that use only one. But which two or more indicators best complement one another? To find out, you need to start with an observation about market behavior that is generally true, then find indicators that measure the observation. For example, an observation that is generally true is that equities stay oversold only briefly in bullish markets, and overbought only briefly in bearish markets. Oscillators are attractive indicators because they lead price. One oscillator that measures overbought versus oversold values is the commodity channel index (CCI). But what will you trade with CCI, how well-behaved is it as a measuring tool, and what other indicators will you use?
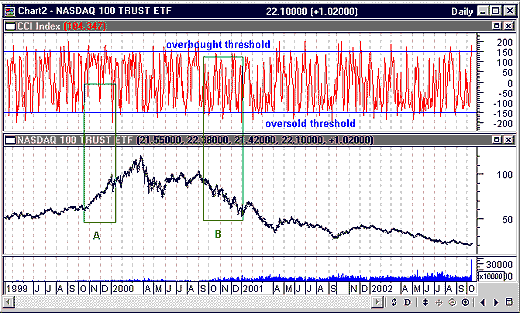
GETTING STARTEDI will consider using CCI on the Nasdaq 100 tracking index (QQQ) because I can get marketwide data on the Nasdaq independently that might give me insight into how the QQQ is behaving. However, first I am going to look at the overall behavior of CCI using a reasonable time frame. My choice of a reasonable time frame is to go back three years, because in mid-1999 the Nasdaq was ending a gradual uptrend and starting to enter a time of heightened volatility. The last three years of the Nasdaq appear to be a robust example of behavior in terms of price and volume volatility. Again, I am opting to use CCI as an overbought or oversold indicator. This is because there is some reasonably predictable behavior in price movements of bull versus bear markets, and market breadth indicators can give me an indication of a bull versus bear market. What do you see when you look at the CCI over the last three years? During late 1999 when the Nasdaq was making a strong move up, QQQ reflected the uptrend and CCI remained overbought (Figure 1, area A). Figure 1, area B, did the opposite — a bear market kept QQQ oversold. But you can also see — and this is important — that CCI is well behaved. CCI extremes are at or near +/-150, and not, for example, hitting unusual extremes such as +/-300. In addition, the CCI doesn't spend much time in the middle ranges; it mostly tends to go from one extreme to the other. What is the significance of all this?
Figure 1: Daily QQQ price and volume; CCI. During strong bull markets, equities can become oversold and stay oversold. For example, area A shows the Nasdaq making a strong move up. At the same time, CCI remains oversold. Bear markets produce the opposite result. Equities remain oversold, as seen in area B.
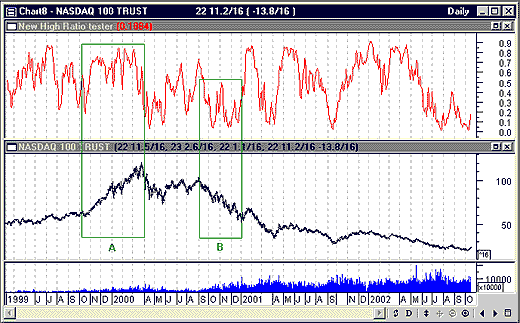
BUILDING ITIf you are going to build a trading system that uses overbought/oversold thresholds, you will want to buy when oversold and sell when overbought. Sounds easy, right? Not quite. Unfortunately, in a bullish market, price can stay overbought, so if your indicator prompts you to enter long based on being oversold, and exit when overbought, you may find yourself exiting your position earlier than planned, since the overbought threshold will be reached at the early stages of a trend. You may then be prompted to enter a short position when the indicator is in the overbought threshold. If this is a bullish market and you enter a short position when it's overbought, you will take a large loss because the equity will stay in the overbought area. In other words, taking short positions based on an overbought threshold, in a bull market, is a losing approach. Similarly, taking a long position as soon as you are oversold in a bear market will result in a loss. It's important to know whether you are in a bull or bear market. One way to determine this is by using the ratio of the number of new highs and lows: New highs/(new highs + new lows). Smoothing this ratio by taking a three-day simple moving average, then comparing the results against the QQQ, suggests that the new high and low ratio could be useful in this sense. Next, you'll want to determine whether you could trade the ratio by itself, because that would give you a sense of its reliability. I created a moving average convergence/divergence (MACD) indicator from the ratio by calculating the difference of two moving averages of new highs/(new highs+new lows), so I could determine the momentum of the ratio (Figure 2). In the MetaStock code that follows, the variable diff is the difference of two exponential moving averages, while signal is a moving average of the differences. From looking at the chart, I also knew I would need to pick separate threshold values for entering longs and shorts, as well as exiting. I would therefore enter and exit positions based on momentum, and exceeding a threshold.
Figure 2: Daily QQQ price and volume; smoothed ratio of new highs and lows (upper chart). Specifically, a three-day simple moving average of daily new highs/(new highs+new lows) is shown with daily QQQ. Area A shows that when QQQ was making a strong move up, the ratio of new highs and lows was staying near its upper threshold: 0.7 to 0.9. Conversely, area B shows that when QQQ was making a strong move down, the ratio was near the lower threshold: 0.1 to 0.3. This suggests that the ratio might be useful in identifying a market as being bullish or bearish.
Enter Long: nh:=Security("c:\test\x.nasd-h",C); nl:=Security("c:\test\x.nasd-l",C); ratio:=nh/(nh+nl); diff:=Mov(ratio,opt1,E)-Mov(ratio,opt2,E); signal:=Mov(diff,opt3,E); ratio>opt4 AND signal>diff
Close Long: nh:=Security("c:\test\x.nasd-h",C); nl:=Security("c:\test\x.nasd-l",C); ratio:=nh/(nh+nl); diff:=Mov(ratio,opt1,E)-Mov(ratio,opt2,E); signal:=Mov(diff,opt3,E); ratio<opt6 AND signal<diff
Enter Short: nh:=Security("c:\test\x.nasd-h",C); nl:=Security("c:\test\x.nasd-l",C); ratio:=nh/(nh+nl); diff:=Mov(ratio,opt1,E)-Mov(ratio,opt2,E); signal:=Mov(diff,opt3,E); ratio<opt5 AND signal<diff
Close Short: nh:=Security("c:\test\x.nasd-h",C); nl:=Security("c:\test\x.nasd-l",C); ratio:=nh/(nh+nl); diff:=Mov(ratio,opt1,E)-Mov(ratio,opt2,E); signal:=Mov(diff,opt3,E); ratio>opt7 AND signal<diff
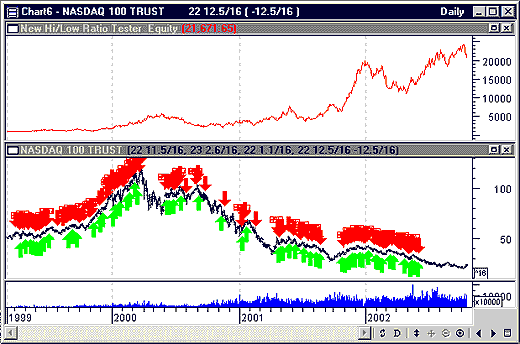
I did a lot of optimizing to see what the thresholds and periods should be. I wouldn't expect this code to trade well, but the result is a $20,000 profit over four years on a $1,000 initial investment. It uses a one-day delay on entry but exits on the same day as the day of the close signal (Figure 3). Although there are a large number of trades through April 2000, as indicated by the numerous green up and red down arrows, the system kept making money. The most serious drawdown occurred at the beginning of 2002. The optimization values for opt1 through opt 7 were 7, 16, 2, 0.4, 1, 0.3, and 0.6.
Figure 3: Daily QQQ price and volume; equity performance (upper chart). Initially $1,000 was invested, and a 50% margin was used to achieve a $20,000 profit (with a bit of a rocky ride). The green up arrows are the entries for long positions, while the red down arrows are the entries for the short positions. You can make money using new highs and lows, although you generally must keep using the system for a year or more to make up losses.
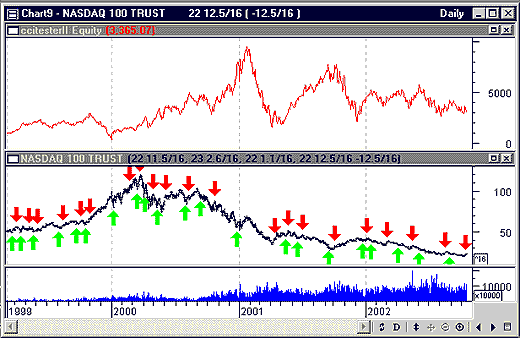
If you examine how CCI would trade on its own, you would find an equity performance that is quite poor (Figure 4). Despite the fact I optimized everything in sight, using CCI thresholds alone is not much help with something like the QQQ. Using the CCI alone, however, does perform better in 2002 than the ratio of new highs and lows.
Figure 4: Daily QQQ price and volume; equity performance (upper chart). With $1,000 initially invested, and a 50% margin, you achieve a $3,000 profit with a very rocky ride.
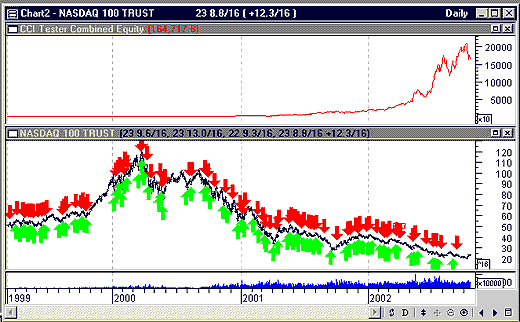
Let's say you combined these two in an attempt to use the most reliable aspects of each. You would want to buy when oversold in a bull market, and short when overbought in a bear market. Your definition of a bull market should state that the ratio of new highs and lows is greater than a threshold, or the ratio momentum is positive. In either case you wait until you see that you are oversold using CCI. You'll do just the opposite for shorts. Remember, look for overbought conditions in a bear market. I found mechanically closing the positions to be a problem. If you are in a bull market, you want to wait until the ratio momentum turns negative before you get out, but how negative still seems to be a judgment call. It would be easiest just to daytrade the exit, rather than have the system tell you it's time to get out. As mentioned previously, the CCI leads price changes by a time period. This period varies depending on whether the market is bullish or bearish. But when you optimize you are forced to pick a number that fits all situations, which is not realistic. Nevertheless, the system achieves a $160,000 profit over four years starting with an initial $1,000 investment (Figure 5). Entries are at the open of the day following the signal, while positions are closed on the same day. A 50% margin was used. This looks pretty good, but as always, the devil is the details.
Figure 5: Daily QQQ price and volume; equity performance (upper chart). $1,000 is initially invested, and a 50% margin is used to achieve a $160,000 profit with only one apparent rough spot. Given that MetaStock is investing all of your equity for each trade, the late 2002 drawdown is exaggerated.
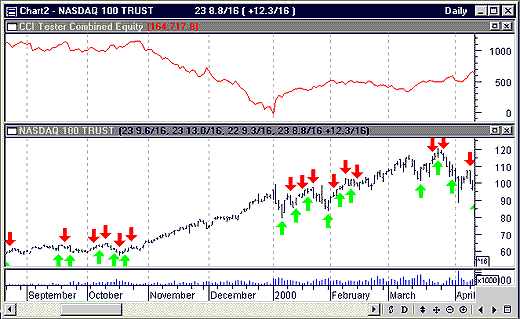
DETAILS, DETAILSWhen you examine these trades in more detail, you should notice the action in late 1999. It shows the limitation of a mechanical system. You can see that the first 11 trades in 2000 are generally right, but being short in mid- to late October 1999 (Figure 6), with dotcom mania in full blossom, was ridiculous. This shows some common sense needs to be exercised. The system had 105 winning trades and 56 losing ones, with an average win of $1,755.16 and an average loss of $500.14. Since MetaStock trades your entire equity each time plus margin, you are making some very large trades as equity builds.
Figure 6: The best and the worst. A strong bull run is initiated in October 1999, and the mechanical part of the trading system won't let you exit out of the short because the market was too bullish. Daytrading would prevent this problem. Looking at the performance in early 2000, the system is behaving extremely well as equity builds, but gets caught in a short position while the market is still bullish.
In this environment, the largest win was $20,501.62, while the largest loss was $11,341.16. The longest string of consecutive wins was 14, and losses, four. In the MetaStock formula that follows, opt1=6, opt2=6, opt4=9, opt5=-140, opt6=4, opt7=30, opt8=180, and opt9=-130. Opt3 was used initially, but I discarded it later and didn't rewrite the code to have consecutive optimization numbers.
Long entry: Go long if oversold and momentum is positive, or if oversold and ratio is in a bullish range. nh:=Security("c:\test\x.nasd-h",C); nl:=Security("c:\test\x.nasd-l",C); nhnlratio:=nh/(nh+nl);diff:=Mov(nhnlratio,7,E)-Mov(nhnlratio,16,E);signal:=Mov(diff,2,E); (nhnlratio>.4 AND Alert(CCI(opt1)<opt5,opt4)) OR (signal>diff AND Alert(CCI(opt1)<opt5,opt4))
Close long: Exit a long position if the ratio is below an upper band, the momentum is negative, and price is still slightly overbought. This is a poor substitute for daytrading, but the best I could do mechanically.
nh:=Security("c:\test\x.nasd-h",C); nl:=Security("c:\test\x.nasd-l",C); nhnlratio:=nh/(nh+nl);diff:=Mov(nhnlratio,7,E)-Mov(nhnlratio,16,E);signal:=Mov(diff,2,E); nhnlratio<.6 AND signal<diff AND CCI(opt1)>opt8
Enter short: Go short if overbought. This was a more extensive test in the beginning using negative ratio momentum along with being overbought, but the equity performance saw no difference.
nh:=Security("c:\test\x.nasd-h",C); nl:=Security("c:\test\x.nasd-l",C); nhnlratio:=nh/(nh+nl);diff:=Mov(nhnlratio,7,E)-Mov(nhnlratio,16,E);signal:=Mov(diff,2,E); Alert(CCI(opt2)>opt7,opt6)
Close short: Exit a short position if the ratio indicates the market is becoming bullish and prices are looking oversold.
nh:=Security("c:\test\x.nasd-h",C); nl:=Security("c:\test\x.nasd-l",C); nhnlratio:=nh/(nh+nl);diff:=Mov(nhnlratio,7,E)-Mov(nhnlratio,16,E);signal:=Mov(diff,2,E); nhnlratio>.6 AND signal>diff AND CCI(opt2)<opt9
I didn't use any stops in this example. For that you would want to look at maximum favorable excursion and maximum adverse excursion.
SUMMARYTrading works better when you're using two indicators. It's always exciting when the equity performance ends up with X10 in the corner (Figure 5). But where are the gains? Mechanically, they take place when the QQQ is moving sideways. Typically, a market moves sideways at least 50% of the time (except for the QQQ, which seems to have been on a roller-coaster ride, as can be seen in Figure 6). A previous system I wrote about used Bollinger Bands to take advantage of trending equities. This system works better with sideways-moving equities. Many of you may be trying to find a system that works well for both trends and trading ranges, but that probably doesn't exist. The best thing to do is to protect yourself with stops and select a system that fits your trading personality.
Dennis D. Peterson may be reached at DPeterson@Traders.com.
RELATED READINGPeterson, Dennis D. [2002]. "Bollinger Bands," Working Money, April 30.MetaStock (Equis International) eSignal (data)
Current and past articles from Working Money, The Investors' Magazine, can be found at Working-Money.com.
|
Market index trading on a daily basis.
| Title: | Staff Writer |
| Company: | Technical Analysis, Inc. |
| Address: | 4757 California Ave SW |
| Seattle, WA 98116-4499 | |
| Phone # for sales: | 206 938 0570 |
| Fax: | 206 938 1307 |
| Website: | working-money.com |
| E-mail address: | dpeterson@traders.com |
Traders' Resource Links | |
| Charting the Stock Market: The Wyckoff Method -- Books | |
| Working-Money.com -- Online Trading Services | |
| Traders.com Advantage -- Online Trading Services | |
| Technical Analysis of Stocks & Commodities -- Publications and Newsletters | |
| Working Money, at Working-Money.com -- Publications and Newsletters | |
| Traders.com Advantage -- Publications and Newsletters | |
| Professional Traders Starter Kit -- Software | |
PRINT THIS ARTICLE

Request Information From Our Sponsors
- StockCharts.com, Inc.
- Candle Patterns
- Candlestick Charting Explained
- Intermarket Technical Analysis
- John Murphy on Chart Analysis
- John Murphy's Chart Pattern Recognition
- John Murphy's Market Message
- MurphyExplainsMarketAnalysis-Intermarket Analysis
- MurphyExplainsMarketAnalysis-Visual Analysis
- StockCharts.com
- Technical Analysis of the Financial Markets
- The Visual Investor
- VectorVest, Inc.
- Executive Premier Workshop
- One-Day Options Course
- OptionsPro
- Retirement Income Workshop
- Sure-Fire Trading Systems (VectorVest, Inc.)
- Trading as a Business Workshop
- VectorVest 7 EOD
- VectorVest 7 RealTime/IntraDay
- VectorVest AutoTester
- VectorVest Educational Services
- VectorVest OnLine
- VectorVest Options Analyzer
- VectorVest ProGraphics v6.0
- VectorVest ProTrader 7
- VectorVest RealTime Derby Tool
- VectorVest Simulator
- VectorVest Variator
- VectorVest Watchdog

