HOT TOPICS LIST
- Strategies
- Stocks
- Buy
- Investing
- Brokers
- Psychology
- Interviews
- Accumulate
- Sell
- Hold
- Spotlight
- Websites
- Candlestick Corner
- Gold & Metals
- Options Trading
LIST OF TOPICS
MARKET COMMENTARY
Bear Market Bottoms
11/05/02 03:51:28 PM PSTby David Penn
Can history help us recognize the end of the bear market before it arrives?
| The rally in equities during October 2002 appeared like a land bird spotted by someone lost at sea. In some respects, given the depth of the decline in indexes such as the Standard & Poor's 500 index since March 2002 (and before that, the decline since March 2000), it is almost surprising that more commotion hasn't been made out of the S&P 500's 130-point, 17% rally, which began with the bottom of October 10. With the current bear market beginning to rival historical bear markets in both length and severity, it is hard to blame those who buy stocks for feeling that enough is enough . . . it's time for stocks to rally. Is "PO'd" an official stage — somewhere between anger and dejection — in the course of the typical bear market? There was a growing sense, as the markets began to move upward again in the second half of October, that investors had taken enough punishment — as if there were some not-so-benevolent god of the markets hurling down thunderbolts in the form of corporate crooks, war anxieties, terrorism, and depressed corporate earnings. Experienced traders, of course, would recognize this thinking as hope, pure and simple. But legions of still relatively green investors seem to believe that as long as they take their "punishment," then the market will reward them with a return to the sort of historic overperformance that got investors so giddy about investing in the first place. This, unfortunately, sets up a sort of "Are we there yet?" watched-pot syndrome in the minds of average investors — a condition that, ironically, makes the market all the more prone to move lower before it moves higher. So what do bear markets look like before they end? And will knowing what bear market bottoms have looked like in the past provide any guidance toward recognizing the end of our current bear market in equities? While every bear market has its own distinct circumstance, context, and style, reviewing the characteristics of those bear markets — particularly how they were eventually resolved — provides at a minimum some sense of how bear markets can end, whether or not the current bear market ends in a similar fashion.
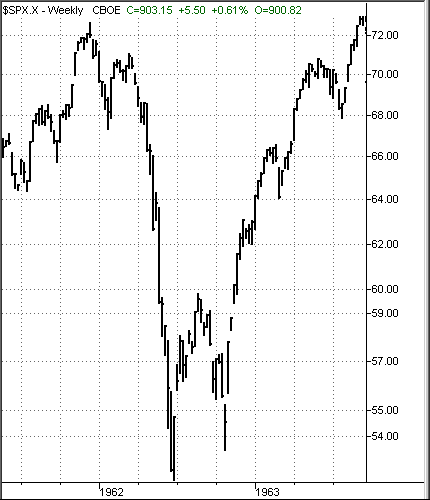
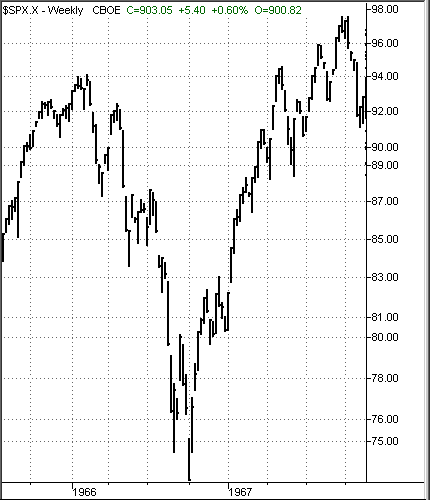
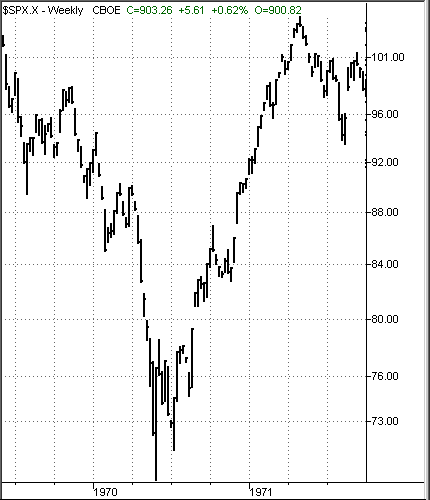
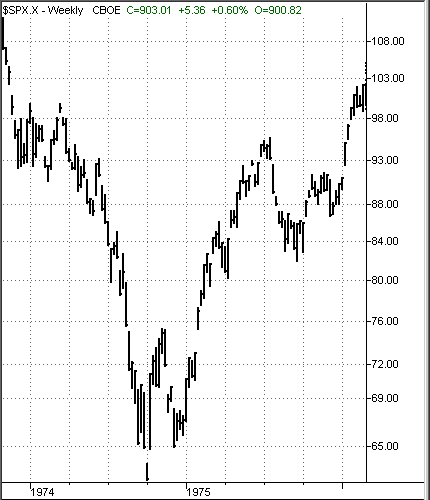
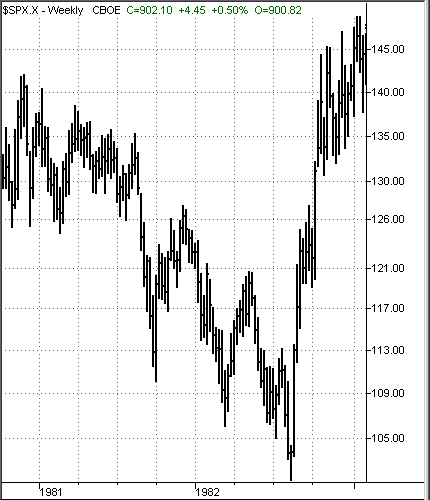
CYCLICAL BEARS IN SECULAR BEARSA distinction should be made between cyclical bear markets in the course of secular bull markets (such as the recent cyclical bear markets in 1987 and 1991) and those cyclical bear markets that occur in the midst of long-term, or secular, bear markets. While cyclical bears in secular bull markets can be both sharp and swift (1987) as well as slow and stagnant (1991), cyclical bear markets in secular bear markets tend to be much more broad-based in their destruction, longer-lasting in their declines, and thus, tend to be all the more amazing upon their resolution. Even a cursory look at Figure 1 of the 1962 bear market should show why so many observers have become anxious about the prospects for a market bottom here in October 2002. In fact, this double-bottom pattern is remarkably constant over the number of cyclical bear markets experienced during the secular bear market from 1966 to 1982 — occurring also during the 196667 bear market (with some modification) as you can see from Figure 2, the 1970 bear market (Figure 3), the 197475 bear market (Figure 4), and the bear market of 198182 again, with some modification (Figure 5).
Figure 1: The bear market of 1962 was the prelude to two decades of relentlessly cyclical bear markets.
Figure 2: It took a lower low in the S&P 500 before stocks were finally able to rally in the second half of 1966.
Figure 3: The 1970 bear market was in many ways a repeat of the 1966 bear market in magnitude and duration.
Figure 4: The 197374 bear market was the worst correction of the secular bear market that began in 1966 and ended in 1982.
Figure 5: Although equities had bottomed years before in the previous 197374 bear market, economic woes battered the stock market in the early 1980s.
Although conventional wisdom suggests that markets reach a new extreme low, rally, then test that previous extreme low before moving up, the figures accompanying this article show that the initial extreme low in some instances would be followed by an even lower low (which should suggest a failed test). The fact that stocks have rallied and bear markets ended in the wake of this lower low, then, appears to make the conventional wisdom on bear market bottoms seem somewhat less conventional. The 1966 bear market shows another characteristic of bear market bottoms in the secular bear market from 1966 to 1982: the lightning-quick move from the bottom. Much has been said by technical analysts about the "treacherous nature of bear market rallies" (to use investment advisor Marc Faber's term). Gary Kaltbaum, a particularly talented technical analyst and money manager, has repeatedly warned clients and listeners of his daily radio program what bear market rallies are: "Sharp, quick, make you feel good, and they screw you later." By all accounts, Kaltbaum is absolutely correct. The problem? The ends of bear markets are no less quick and no less sharp. It could be that the difference between a bear market rally and the true end of a cyclical bear market is not so much the speed with which stocks move up from the bottom, but rather the sentiments of investors when headed toward the bottom. This, again, underscores the importance of differentiating between cyclical bear markets in secular bull markets (in which a temporary fear interrupts the general climate of greed), and cyclical bear markets in secular bear markets (in which repeated waves of fear are briefly interrupted by greed). The secular bear market from 1966 to 1982 is the prime example of those who have long criticized the buy and hold stock investing mantra that became almost ideologically overwhelming during the late stages of the 19822000 secular bull market. The period from 1966 to 1982, these critics assert, shows that those who had purchased stocks in the mid-1960s and held on to them until the early 1980s would have had little, if anything, to show for their patience. While this is evident in the charts provided (compare Figures 1 and 2 to Figure 5), this reasoning does not necessarily seal any argument against stock investing, or trading for that matter, during the period. Nevertheless, the sheer magnitude of the oscillations between 1966 and 1982 were such that many a savvy trader or fleet-footed investor could take advantage of powerful market rallies (and equally destructive corrections) in order to rack up solid equity gains. Compare the 1962, 1966, and 1970 bear market bottoms: Relatively low-risk buying opportunities emerged in the fourth quarter of 1962, the first quarter of 1967, and the fourth quarter of 1970. When these opportunities emerged, all of the respective rallies were less than halfway to their eventual tops. For example, the S&P 500 was a low-risk buy at 83 in January 1967, having fallen from 94 to under 75 in 1966. From 83 in January 1967, the S&P 500 continued to climb until the fourth quarter of 1968 when it reached 108 — a gain of 30%. Similarly, the S&P 500 became a low-risk buy in the fourth quarter of 1970 between 84 and 88. The S&P 500 continued to climb until it finally topped out at 120 in the first quarter of 1973 — a gain of more than 36%.
WORST BEARS OF THE BUNCHThe two final cyclical bear markets in the 196682 secular bear market were also the two worst, in terms of equity declines and the severity of recession. The good news about these two cyclical bear markets is that they were comparable in intensity to the bear market we are currently experiencing — and thus should be even more valuable for purposes of comparison than the cyclical bears presented so far. The bad news is that the 197475 bear market came in the middle of the secular bear market, and the 198182 bear market arrived as the secular bear market was ending. This suggests that, unless we are closer to the end of our secular bear market than the beginning, even these comparisons may fall short of helping us understand just where this cyclical bear market is headed. Remarkable mostly for its magnitude, the 197374 cyclical bear market took stocks from a high of about 120 in the S&P 500 at the beginning of 1973 down to a low of 62 in October 1974, a loss of more than 48%. One interesting contrast between the 197374 decline and the 2000 to present bear market is the fact that, by 1973, investors' nerves had already been battered by almost 10 years of markets that would drop 20 to 30 points in the S&P 500, only to rise again by 20 or 30 points. In fact, by 1974, investors had already suffered through four steep corrections since 1962. It is not hard to imagine that, by the time of the 197374 correction, the average investor was more than ready to throw in the towel as far as stocks were concerned. After all, it is just such a capitulation that is necessary to drive stocks to levels where they are finally bargains in real terms. The last bear market of the 196682 secular bear market was between 1981 and 1982, with the United States listing in a sea of radical inflation (again) and equally radical efforts by the Federal Reserve Board to bring inflation under control. The resulting increase in interest rates (long government Treasuries were sporting yields of 15% or better) was the perfect economy-killing storm, as the economy slipped into its deepest recession since the Great Depression. Losses in equities — as reflected in the S&P 500 — were more on the order of the "common" cyclical bear markets between 1962 and 1973 with a decline of about 26%. But one of the major functions of the 198182 bear market (in addition to killing inflation) was to serve as a last moment of despair for those whose hopes for profitable investments in stocks were not quashed by the 197374 decline. Let us keep in mind it was during the 198182 bear market — not the 197374 decline — that BusinessWeek printed its infamous "The Death of Equities" cover.
CYCLICAL VERSUS SECULARIt is exceptionally difficult to locate the bottom in a falling market before it occurs. Even with the help of chart patterns, Fibonacci retracements, 30-week moving averages, and Elliott wave counts, the understandable if unhelpful "Are we there yet?" syndrome makes investors and traders all too eager to overinterpret their data and research. This often results in spotting bottoms that turn out to be merely consolidations on a continuing trip downward. Yet, as this survey of the cyclical bear market shows, it is a fact that long-term or secular bear markets consist of repeated episodes of bullishness and bearishness, and that each of these episodes can last long enough for alert investors and traders to take advantage of them. Thus, it is perhaps more important to understand how to confirm a bottom has been put in place than to anticipate which low is the low. As mentioned previously, investors who spotted low-risk buying opportunities (generally, when prices move higher than the previous rally high following the initial cyclical bear market low) could enjoy 20% to 30% returns before markets peaked out, usually within 1218 months after the cyclical low. That may not be as sexy as buying the S&P 500 in 1974 at 65, but from a risk/reward standpoint, waiting for some form of bullish confirmation is a safer way to travel. It's also important to realize that secular bear markets will have repeated episodes of bullishness and bearishness, and that to call a bottom to a cyclical bear market (as many astute observers did in 1962, and perhaps again in 1966, and again in 1970) is not necessarily the same thing as calling for a secular market bottom. Investors in the mid- to late 1960s and the early 1970s still had 197374 to endure before they were even close to clear sailing. This might be worth remembering in October 2002, after more than two years of bear market declines, when talk about bottoms and double bottoms is as hot and heavy as it has been since the secular bear market began. Even if the current, two-year market slide ends in October, savvy investors are best off considering the merits of conservative investing in the event that the October rally turns into just another island of greed in a sea of stock market fear.
David Penn may be reached at DPenn@Traders.com.
SUGGESTED READINGWeinstein, Stan. [1988]. Secrets Of Profiting In Bull And Bear Markets, Dow Jones Irwin.TradeStation (TradeStation Technologies)
Current and past articles from Working Money, The Investors' Magazine, can be found at Working-Money.com. |
Technical Writer for Technical Analysis of STOCKS & COMMODITIES magazine, Working-Money.com, and Traders.com Advantage.
| Title: | Traders.com Technical Writer |
| Company: | Technical Analysis, Inc. |
| Address: | 4757 California Avenue SW |
| Seattle, WA 98116 | |
| Phone # for sales: | 206 938 0570 |
| Fax: | 206 938 1307 |
| Website: | www.traders.com |
| E-mail address: | DPenn@traders.com |
Traders' Resource Links | |
| Charting the Stock Market: The Wyckoff Method -- Books | |
| Working-Money.com -- Online Trading Services | |
| Traders.com Advantage -- Online Trading Services | |
| Technical Analysis of Stocks & Commodities -- Publications and Newsletters | |
| Working Money, at Working-Money.com -- Publications and Newsletters | |
| Traders.com Advantage -- Publications and Newsletters | |
| Professional Traders Starter Kit -- Software | |
PRINT THIS ARTICLE

Request Information From Our Sponsors
- StockCharts.com, Inc.
- Candle Patterns
- Candlestick Charting Explained
- Intermarket Technical Analysis
- John Murphy on Chart Analysis
- John Murphy's Chart Pattern Recognition
- John Murphy's Market Message
- MurphyExplainsMarketAnalysis-Intermarket Analysis
- MurphyExplainsMarketAnalysis-Visual Analysis
- StockCharts.com
- Technical Analysis of the Financial Markets
- The Visual Investor
- VectorVest, Inc.
- Executive Premier Workshop
- One-Day Options Course
- OptionsPro
- Retirement Income Workshop
- Sure-Fire Trading Systems (VectorVest, Inc.)
- Trading as a Business Workshop
- VectorVest 7 EOD
- VectorVest 7 RealTime/IntraDay
- VectorVest AutoTester
- VectorVest Educational Services
- VectorVest OnLine
- VectorVest Options Analyzer
- VectorVest ProGraphics v6.0
- VectorVest ProTrader 7
- VectorVest RealTime Derby Tool
- VectorVest Simulator
- VectorVest Variator
- VectorVest Watchdog

