HOT TOPICS LIST
- Strategies
- Stocks
- Buy
- Investing
- Brokers
- Psychology
- Interviews
- Accumulate
- Sell
- Hold
- Spotlight
- Websites
- Candlestick Corner
- Gold & Metals
- Options Trading
LIST OF TOPICS
THE CHARTIST
Learning The Technimental Three-Step
11/19/02 01:41:24 PM PSTby Matt Blackman
Technicals and fundamentals: together at last.
| Traditionally, technical and fundamental analysts have been miles apart. Each believes the other is missing the boat in market interpretation. East is east and west is west, but those who can put the two together have an advantage over the competition. AN UNLIKELY MARRIAGE The division between technical and fundamental analysts has historically been more of a chasm than a line. It's as if the two groups are from different countries that have been at war for the last 80 years. Diehard technical analysts believe that everything they need to know can be found in the charts. By the time the public knows the fundamentals, the markets have already discounted them. As evidence of the failings of fundamental analysis, technicians point to the abysmal Wall Street track record of the last three years, when less than 1% of the brokerage analysts' recommendations were "sells" in a falling market. Fundamentalists, on the other hand, charge technical analysts with blindly using the past (that is, chart patterns) to predict the future. Fundamentalists opine it is like driving on the freeway solely by looking in the rear-view mirror. History cannot be relied upon to accurately tell us where stock prices are going, they argue. Granted, there are times when fundamental data is fully priced into a stock chart, but in depressed markets a gradual growth in revenues and earnings will not be fully factored into price until sentiment changes. On the flip side, a deteriorating revenue picture and unrealistic price-to-earnings, price-to-sales, or price-to-book ratios are often ignored when irrational exuberance dominates, as was so clear during the recent bull market. An understanding of historical fundamental relationships is useful in detecting price imbalances. Likewise, chart patterns and technical indicators can help investors anticipate market movements. If they learn how to read them, charts can help traders avoid market downturns or catch updrafts. The reality is that both types of analysis can be useful when applied together, especially when looking at time frames longer than a day or two. This unlikely union is called technimental analysis. Let's look at how technimental analysis works and how you can use it to reduce losses and maximize returns.
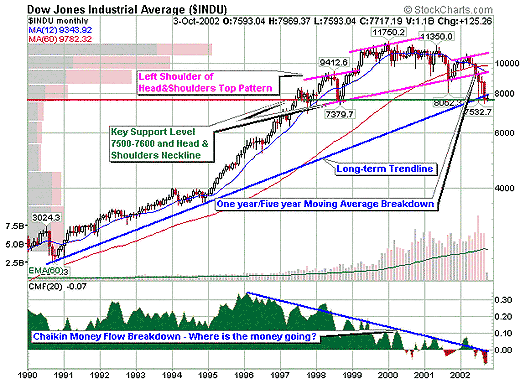
TECHNICALS FOR FUNDAMENTALISTSAnyone who follows North American business broadcasts or financial publications can attest to the number of analysts, mutual fund managers, bankers, and brokers currently claiming that the market is approaching a bottom. It is a message that has often been repeated since September 2001. Experts argue that valuations have come down significantly, the economy is recovering, and that many blue-chip stocks are at multiyear lows. How many times have you heard buy recommendations from seemingly credible professionals this year, only to watch the recommended stocks plummet shortly thereafter? Picking a bottom can be highly detrimental to your financial (and emotional) well-being, but even the most seasoned fundamental professionals choose to ignore that fact. This error can be avoided by consulting the charts: for example; look at Figure 1.
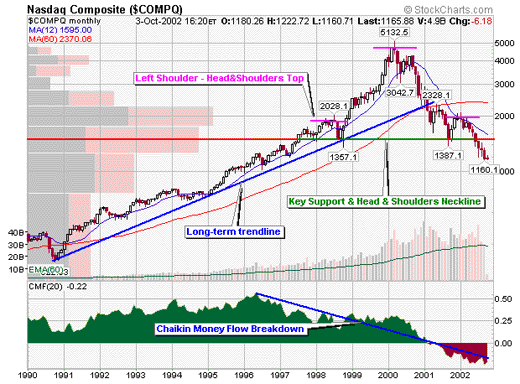
Figure 1: Monthly chart of the Dow Jones Industrial Average, 19902002. On first glance, the most obvious non sequitur in this chart of the DJIA is the divergence between Chaikin money flow and price. This indicator identifies market strength or weakness based on volume. As the name implies, it provides a glimpse of money moving into or out of an equity, and thus can provide advance warning of an impending price change. Thanks to the irrational exuberance that predominated for most of the 1990s, it took nearly three years for the drop to express itself in lower prices. Anyone who understood the relationship between the two could see it coming, although few knew exactly when. Money flow has continued to drop into the fourth quarter of 2002, which does not bode well for a sustained technical recovery in late 2002 or early 2003. Equally telling is the confirmation of a head and shoulders top (HST) chart pattern (magenta lines) that formed from 1998 through 2002. Of all chart patterns, the head and shoulders is one of the most reliable, and warns of or confirms a reversal pattern. Price broke through the (magenta) neckline in July 2002 and continued down into October. Two more indicators confirmed the negative dominant trend. The Dow Jones industrial average dropped convincingly below the long-term trend (blue) line in September. Also note the bearish cross of the (red) 12-month under the (blue) 60-month moving average in July. As you see from Figure 2, the same HST holds true for the Nasdaq Composite index. There was also a breakdown of price below the (blue) long-term trendline and a bearish 12/60-month moving average cross.
Figure 2: Nasdaq Composite monthly chart 19902002.
From a charting standpoint, there are at least three good reasons to exercise extreme caution in buying, and few (if any) clear technical reasons to expect a sustained recovery in the near term. This should give the fundamental investor, and anyone else, serious reason to rethink a bottom-picking strategy until a trend reversal occurs.
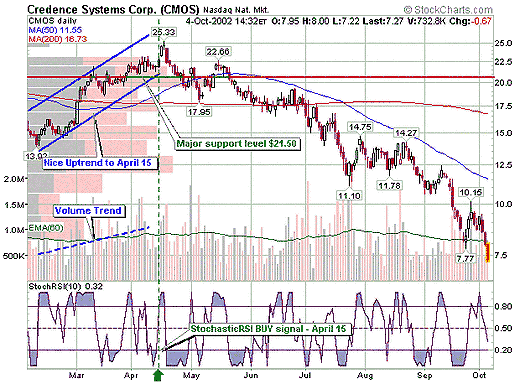
FUNDAMENTALS FOR THE TECHNICIANIt's difficult to describe the technical trader's advantages when using fundamental data, so here's an example. On April 15, 2002, Credence Systems (CMOS) generated a 10-period stochastic relative strength index (RSI) momentum buy signal. The chart looked as if it held some promise at the time, as it had been in a relatively strong uptrend since February. But a quick look at the company revealed a different picture (Figure 3).
Figure 3: Daily Credence Systems chart showed promising technicals from February to April 2002.
First, revenues had dropped steadily in the previous three quarters, and earnings were strongly negative as well, averaging a loss of more than $0.50/share per quarter, producing a price-to-earnings ratio that read "not applicable." Second, insider shares sales greatly outnumbered shares purchased. Not good. Did the insiders know something the public didn't? If they were selling, why should anyone else buy? Finally, the ratio of short sales had increased and exceeded the maximum 5% of float rule. If more than 5% of the float is held short, and the short position has increased dramatically in the last reporting period, it means the smart money is betting the stock will drop. While this last indicator is not always reliable, it cannot be ignored. A large short position against a security is like a millstone around the stock's neck as it tries to move up the chart. Positive news will have a reduced buoyancy effect, and negative news can cause the security to sink like a stone. Because of this, it was not advisable to buy Credence Systems at that time. As it turned out, taking the opposite tack and selling short would have been a better idea. The stock dropped nearly 10% on April 18 and continued to shed nearly 60% of its value over the next six months (note the HST pattern that formed between March and June). It is my habit to take at least a cursory look at the fundamentals of any stock I am looking to trade. This can take time, but the practice has saved me on more than one occasion. The short-term or daytrader may not have the luxury to indulge such a practice, but my goal is to find stocks that are trending in either direction and to stay with them as long as they are profitable, increasing my risk tolerance to a maximum 50% of accrued profits. If I can find a stock in a trend and stay with it for weeks or even months, all the better.
ONE, TWO, THREE . . . TRADE!In Technical Analysis Of The Financial Markets, John Murphy points out that:
The chartist can easily follow as many markets as desired, which is generally not true of his or her fundamental counterpart because of the tremendous amount of data the latter must deal with. Is there any reason the fundamentalist cannot use technical tricks to widen investment horizons and supercharge returns? Thanks to readily available fundamental information in the way of ratios and numerical data, the technical trader can quickly check on a trade candidate. Here are some suggested steps:
COMBINING FORCES: THE BEAR TAMER?It is important to remember the longest bull market in history started in 1982 and ended in March 2000. During that time, buy-and-hold investors did well. Since the end of the bull, however, most of these investors have lost their shirts. Buy and hold is the best way to get eaten alive when the bears rule. How long will the bear market last, and will it be remembered as the longest in history one day? Are there any compelling technical or fundamental reasons why the DJIA can't drop to 5,000, or the Standard & Poor's 500 index can't drop to 500, as has been forecast by experts in both fundamental and technical camps? Market historians will remember the second longest bull market lasted from 1949 to 1966. The bear market that followed bottomed in 1974, and prices did not return to 1966 levels until 1982-83. It is entirely possible we may not see March 2000 prices again until 2010 or later, if the past is any guide. If the 1990s were ruled by irrational exuberance, the market is now ruled by irrational dismay interspersed with periods of desperate hope. Just as it did in the 1990s, overreaction will continue long after the news has stopped flowing. Making money in this environment will require the intelligent application of technology and data together like never before. Failure to consider both fundamental and technical factors in the challenging times ahead will put traders and investors at a significant competitive disadvantage. Is that a handicap that you and your portfolio can afford?
Matt Blackman is a trader, technical analyst, software and book reviewer, and a content provider for www.thechartmaster.com. He can be reached at matt@goldhaven.com. Matt lives in Vancouver, B.C.
SUGGESTED READINGHartle, Thom [1994]. "Trading A Stock Using Technical Analysis," Technical Analysis of Stocks & Commodities, Volume 12: July.Murphy, John J. [1999]. Technical Analysis Of The Financial Markets, New York Institute of Finance. Wood, Tim W. [2002]. "When Will This Cruel Bear Market Be Over?" Working Money: July. Charts courtesy of StockCharts.com
Current and past articles from Working Money, The Investors' Magazine, can be found at Working-Money.com.
|
Matt Blackman is a full-time technical and financial writer and trader. He produces corporate and financial newsletters, and assists clients in getting published in the mainstream media. He tweets about stocks he is watching at www.twitter.com/RatioTrade Matt has earned the Chartered Market Technician (CMT) designation.
| E-mail address: | indextradermb@gmail.com |
PRINT THIS ARTICLE

Request Information From Our Sponsors
- StockCharts.com, Inc.
- Candle Patterns
- Candlestick Charting Explained
- Intermarket Technical Analysis
- John Murphy on Chart Analysis
- John Murphy's Chart Pattern Recognition
- John Murphy's Market Message
- MurphyExplainsMarketAnalysis-Intermarket Analysis
- MurphyExplainsMarketAnalysis-Visual Analysis
- StockCharts.com
- Technical Analysis of the Financial Markets
- The Visual Investor
- VectorVest, Inc.
- Executive Premier Workshop
- One-Day Options Course
- OptionsPro
- Retirement Income Workshop
- Sure-Fire Trading Systems (VectorVest, Inc.)
- Trading as a Business Workshop
- VectorVest 7 EOD
- VectorVest 7 RealTime/IntraDay
- VectorVest AutoTester
- VectorVest Educational Services
- VectorVest OnLine
- VectorVest Options Analyzer
- VectorVest ProGraphics v6.0
- VectorVest ProTrader 7
- VectorVest RealTime Derby Tool
- VectorVest Simulator
- VectorVest Variator
- VectorVest Watchdog


