HOT TOPICS LIST
- Strategies
- Stocks
- Buy
- Investing
- Brokers
- Psychology
- Interviews
- Accumulate
- Sell
- Hold
- Spotlight
- Websites
- Candlestick Corner
- Gold & Metals
- Options Trading
LIST OF TOPICS
TRADER'S NOTEBOOK
Using Moving Averages To Trade Retracements
11/26/02 04:20:28 PM PSTby Mike Moody
Trading a price retracement amid an established trend can provide you with a low-risk, high-probability trading opportunity.
| Once a trend is established, it typically undergoes several retracements, causing the stock's price to temporarily pull back against the trend. This is a normal occurrence caused by the daily ebb and flow of stock prices. When the retracement ends, if it was not severe enough to cause the trend to change direction, then most of the time the stock price will move back in the direction of the prevailing trend. Since the trade is made in the same direction as the established trend, the end of the retracement and the resumption of the prevailing trend provide an excellent entry point for investors looking to profit from the trend's further progress.
IN THEORYThe rationale for this type of trading opportunity is fairly straightforward. If the prevailing trend has sufficient strength to remain intact following a retracement, then entering the trade just after the retracement has ended can provide you with an excellent trading opportunity at an attractive price. During an uptrend, the stock will be bought in an environment of strengthening demand at a price lower than the most recent high price reached prior to the correction. During a downtrend, the stock will be shorted into weakening demand at a higher price than the low levels preceding the rally. In either case, the probability of a successful trade is good, with increased profit potential and decreased risk.
THE INTERMEDIATE-TERM TRENDI will focus on trading retracements against an intermediate-term trend. Traders who prefer the intermediate time frame usually plan to hold their stocks for a period of one to six months. This time frame will be used to determine the technical definition of the trend. For this article, the definition of an intermediate-term trend is based on the following three characteristics:
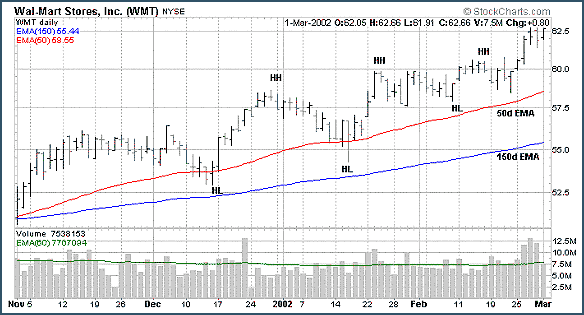
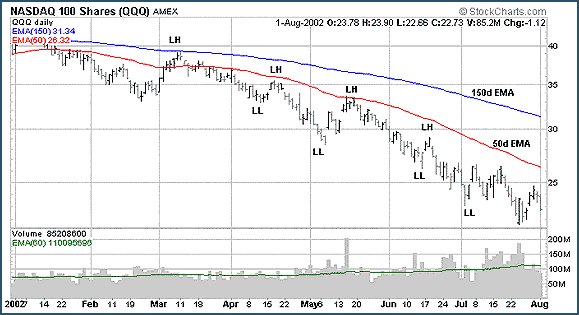
Therefore, in an uptrend, the 150d EMA has an upward slope, the 50d EMA is above the 150d EMA, and price is making progressive sets of higher lows and higher highs (as shown in Figure 1). In similar fashion, a downtrend would have a downward-sloping 150d EMA with the 50d EMA below it, and price making a series of lower highs and lower lows (Figure 2).
Figure 1: A classic uptrend. Note the upward slope of the 150d EMA, with the 50d EMA above it. Also note the series of higher lows (HL) and higher highs (HH).
Figure 2: A classic downtrend. Here you see a downward slope in the 150d EMA, the 50d EMA below the 150d EMA, and a series of lower highs (LH) and lower lows (LL).
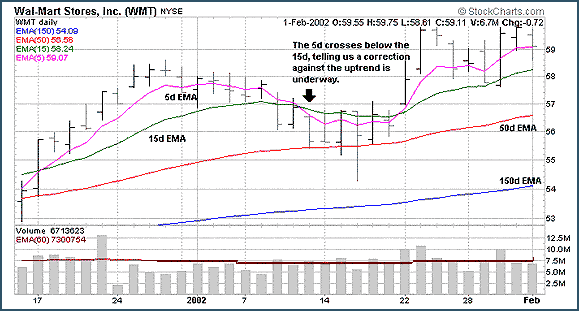
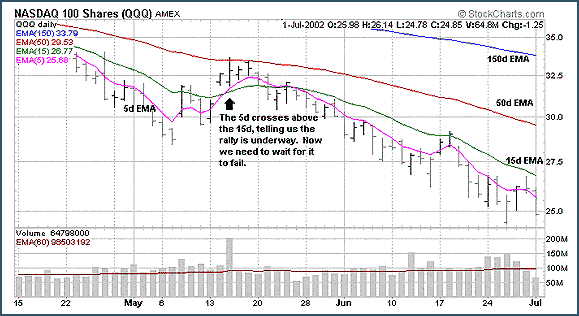
TRADING RETRACEMENTSA retracement is commonly called a correction in an uptrend and a rally in a downtrend. The basic approach to trading a retracement consists of a few steps. First, you'll want to find and confirm the existing trend. This is accomplished by using the moving averages and price action described earlier. Next, you'll look for a retracement of sufficient magnitude to provide a reasonable trading opportunity. In other words, you will want to see price become oversold in an uptrend, indicating that selling pressures (supply) have temporarily overpowered buying pressures (demand). Conversely, you'll want price to become overbought in a downtrend, telling you that buying pressures have temporarily become stronger than selling pressures. Many traders use one or more technical indicators to provide overbought and oversold signals, such as stochastics, %R, and relative strength index (RSI). While these indicators can certainly be used with a high degree of success, a few short-term moving averages work just as well in the intermediate term. To look for a retracement, you can compare the 5d EMA with the 15d EMA. During an uptrend, if the 5d EMA crosses below the 15d EMA, the correction against the uptrend is significant enough to be of interest (shown in Figure 3). Likewise, during a downtrend, when the 5d EMA crosses above the 15d EMA, there could be a short-term rally in the works (see Figure 4).
Figure 3: A retracement within an uptrend. This is evinced by the 5d EMA crossing below the 15d EMA.
Figure 4: A retracement within a downtrend. Here, the 5d EMA crosses above the 15d EMA.
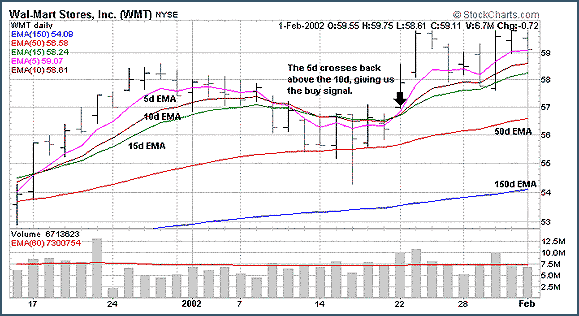
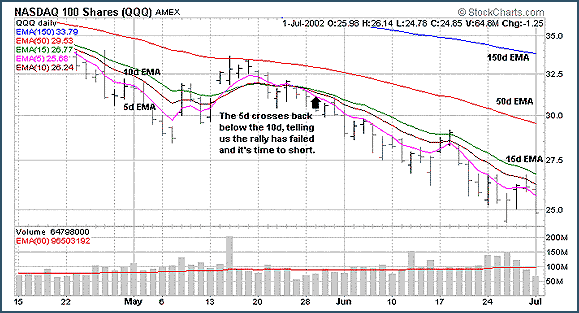
The next step is to wait until the retracement actually ends and price starts moving back in the direction of the prevailing trend. In addition, you'll want the resumption of the price trend to be strong enough to convince you the trend is indeed back under way. In this case, you'll compare the 5d EMA with the 10d EMA in order to catch the prevailing trend fairly soon after it resumes. As soon as the five-day crosses the 10-day in the direction of the trend, you've received a signal to enter a trade. Figure 5 shows the point at which you'd buy a stock in an uptrend. In Figure 6 you see the point at which you would sell a stock short in a downtrend.
Figure 5: Failures do happen. Here you see a correction within an uptrend failing. Prices started moving back up. The buy point is signaled when the 5d EMA crosses above the 10d EMA (see arrow).
Figure 6: Failure during a downtrend. Here, the 5d EMA crosses back below the 10d EMA, giving a signal to sell short (see arrow).
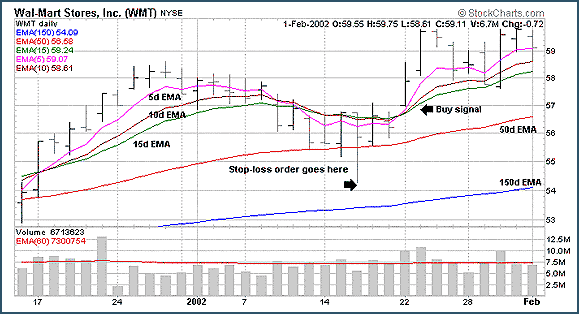
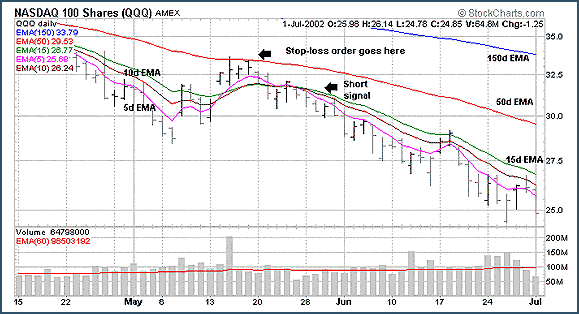
Finally, having received the signal to act, you enter your trade, followed by a stop-loss order to protect you in the event the trend does not continue as anticipated. Determining where to set an initial stop-loss order to protect a position is relatively simple when trading retracements: The stop should be set just beyond the price level the stock reached during the retracement. In an uptrend, the low point reached during the correction gives you a good price level to place your stop. The bounce back up from this price shows you that support was found at this level, so you can set your stop just below it (Figure 7). In a downtrend, the high price of the rally tells you the price at which resistance was hit, and you can set your stop just above it (Figure 8). Of course, if the stop's percentage exceeds your risk threshold, then you should pass on this opportunity and look elsewhere. For example, let's say the maximum risk you are willing to assume in any position is 10%. If a buy opportunity arises that causes you to place a stop at, say 12% above the low price of the correction, then you should not enter the buy order at all. In most cases, however, the 5d EMA will cross the 10d EMA soon enough to let you enter the trade with plenty of room before your risk threshold is reached.
Figure 7: Placing stops. When buying in an uptrend, place the initial stop-loss order just beneath the low point of the correction.
Figure 8: Placing stops for short positions. Place the initial stop-loss order for a short sale in a downtrend just above the high point of the rally.
SUMMARYCombinations of moving averages can be useful for trading retracements that occur within a prevailing trend, offering clear signals for entry points as the trend continues. Trading a retracement can be summarized as follows:
Mike Moody, Ph.D., trades his accounts full-time, specializing in stocks and mutual funds. He has been active in the stock market for more than 25 years, and teaches investment courses at the university level. He can be reached at drmikemoody@yahoo.com Charts courtesy of www.StockCharts.com.
Current and past articles from Working Money, The Investors' Magazine, can be found at Working-Money.com.
|
| E-mail address: | drmikemoody@yahoo.com |
PRINT THIS ARTICLE

Request Information From Our Sponsors
- VectorVest, Inc.
- Executive Premier Workshop
- One-Day Options Course
- OptionsPro
- Retirement Income Workshop
- Sure-Fire Trading Systems (VectorVest, Inc.)
- Trading as a Business Workshop
- VectorVest 7 EOD
- VectorVest 7 RealTime/IntraDay
- VectorVest AutoTester
- VectorVest Educational Services
- VectorVest OnLine
- VectorVest Options Analyzer
- VectorVest ProGraphics v6.0
- VectorVest ProTrader 7
- VectorVest RealTime Derby Tool
- VectorVest Simulator
- VectorVest Variator
- VectorVest Watchdog
- StockCharts.com, Inc.
- Candle Patterns
- Candlestick Charting Explained
- Intermarket Technical Analysis
- John Murphy on Chart Analysis
- John Murphy's Chart Pattern Recognition
- John Murphy's Market Message
- MurphyExplainsMarketAnalysis-Intermarket Analysis
- MurphyExplainsMarketAnalysis-Visual Analysis
- StockCharts.com
- Technical Analysis of the Financial Markets
- The Visual Investor

