HOT TOPICS LIST
- Strategies
- Stocks
- Buy
- Investing
- Brokers
- Psychology
- Interviews
- Accumulate
- Sell
- Hold
- Spotlight
- Websites
- Candlestick Corner
- Gold & Metals
- Options Trading
LIST OF TOPICS
MARKET UPDATE
1-2-3 Trend Reversals
12/10/02 04:45:58 PM PSTby David Penn
Catching a trend reversal can be as easy as 1-2-3.
| As the stock market averages rocketed upward in the first half of October, I couldn't help but wonder how many traders who missed the most explosive part of the move eventually stopped kicking themselves in the keister and began plotting ways of fading the rally. Truly, if the most dangerous thing for the average investor is thinking that rising markets will rise indefinitely, then it seems equally likely that the most dangerous thing for traders (who typically go short as readily as average investors go long) is to assume that falling markets will continue to fall. Thus, it was almost impossible not to imagine legions of traders watching the consolidation in the Dow industrials, Nasdaq, and Standard &Poor's 500 -- a consolidation that began in the second half of October and continued for little over a month -- waiting for signs of a breakdown and a return to the bearish declines they'd come to know (and love) so well. But conventional wisdom suggests that nothing is more perilous than trying to pick tops and bottoms. Regardless of how many veteran traders and technical analysts exhort traders to "stay with the trend," the temptation to be the one who calls the end of the party seems almost overwhelming (full disclosure: this author has hardly been immune to such a temptation). There is more to picking tops and bottoms, however, than just wanting to be the one who saw the end before everyone else. It cannot be doubted, for example, that it was more profitable (if more perilous as well) to short the Nasdaq at 4900 than at 2200. But is there a technique that allows traders to do just that — to fade markets that seem unfadeable, markets that are experiencing soaring bull markets or angst-ridden bearish ones — without being constantly wrong, stopped out time and time again as the market continues to move beyond the point at which enough was supposed to be enough?
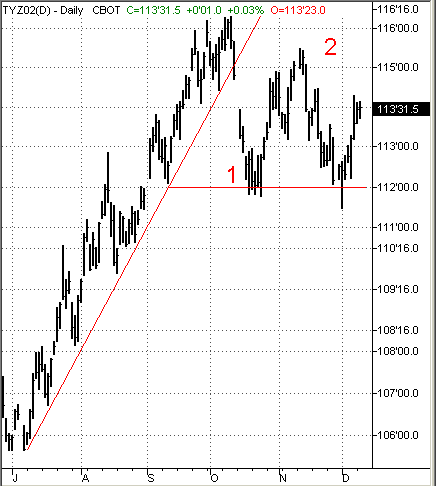
SETTING UP THE REVERSALFortunately, many of the most helpful aspects of technical analysis are also often the simplest. Simple trendlines, support, and resistance remain powerful tools for most traders looking to maximize risk/reward situations. No trading setup is perfect, but the best setups consistently provide traders with opportunities to seize outsized rewards without exposing them to capital-crushing losses. This notion allows traders to be wrong more often than they are right, yet still take sizable profits from the markets. One of the best examples of just such a setup is what I call the 1-2-3 trend reversal, first popularized by Victor Sperandeo in his "Trader Vic" books. What makes the 1-2-3 trend reversal setup so worthwhile is that it is based on simple (and consistently cast) trendlines, as well as basic concepts of support and resistance. As I've noted, there is never a lack of intelligent and talented traders and technical analysts who warn against trying to pick tops and bottoms. But what makes Sperandeo's trend reversal setup so valuable is how it provides traders with a reasonable opportunity to take advantage of a short-, intermediate-, or even long-term potential top or bottom by forcing the market to "prove" its intent to reverse twice over. The first part of the setup involves drawing a correct trendline. Sperandeo considers accurate trendline drawing to be a key factor and fears that too many traders draw trendlines that merely approximate the trend. In Sperandeo's opinion, such trendlines are prone to provide false signals, encouraging traders to become frustrated and all too ready to abandon what remains one of the oldest trading tools around. Sperandeo suggests that trendlines be drawn so they connect the lowest low to the highest low immediately preceding the highest high without crossing any price bars or candlesticks in between. Using the example of the uptrend in the December 10-year Treasury futures contract, a horizontal resistance line would be drawn at the top of the highest high. A horizontal support line would be drawn at the bottom of the highest low. This highest low is often the same "highest low immediately preceding the highest high" used to cast the original trendline. How does the 1-2-3 trend reversal setup work from here? The "1" in the setup refers to a trendline break. Again, using the uptrend in the December 10-year Treasury note (TYZ2 or TYZ02), we see a major trendline break on October 15 as TYZ2 gapped down, inflicting significant technical damage to the uptrend. This was the first hint that a trend reversal might be in the making. The second hint, the "2" in the setup, comes almost a month later. After gapping down in mid-October, TYZ2 consolidated at support around 112. This consolidation, which lasted about six trading days, provided the base for a rally late in October that spilled over into November. TYZ2 rallied for about 12 occasionally seesaw trading days before reaching a peak on November 11.
Figure 1: With its lower high in November, could a trend reversal for the December 10-year Treasury note be at hand?
Writing about the 1-2-3 trend reversal setup, Sperandeo notes that "in terms of trading on the basis of the 1-2-3 criterion, the best way is to trade before condition 3 is met." This means after condition 2, or the inability of the market to regain its upward (or downward) momentum. In the example of the December T-note, this would refer to the days immediately following the November 11th peak. Because it would be impossible for a trader to know that November 11 represented the peak, it is far more likely that the down day on November 14 would have provided the confirmation that — from a risk/reward standpoint — November 11 and 12 marked the rally peak. One way to take advantage of this situation would be to go short just below the low of November 14 (at about 113), with a buy stop above the high (at about 115). The "3" of the 1-2-3 trend reversal (condition 3) would represent the actual breakdown and close beneath the support line at about 112.
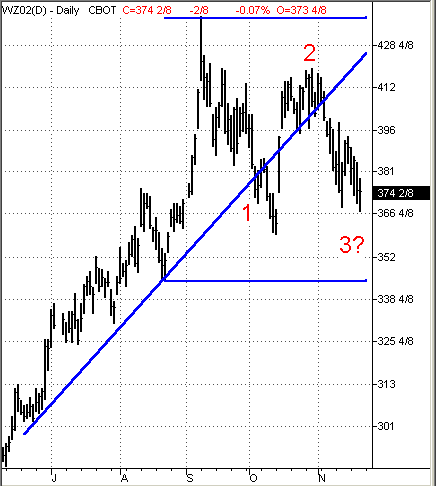
CALCULATING RISK AND REWARDHow can the reward end of the trade be calculated? The simplest way would be to apply the "swing rule" that Stan Weinstein writes about in his classic Secrets For Profiting In Bull And Bear Markets. This rule (which I wrote about recently in "Livestock's Last Upswing," Traders.com Advantage, November 21, 2002) suggests the range from support (the more recent correction low) to resistance (the peak of the uptrend) measures the distance downward in the event that the trend reverses and support is broken. In the current example, the range from support (112) to resistance (116.35) is about 4.35, which suggests a downside target of about 107.65 — again, should the support level be broken by a condition 3. If the short position was initiated at 113 with a buy stop at 115, then the likely risk/reward ratio would be 2 to 5.35, or a little better than 1 to 2.5. This is not an extremely favorable risk/reward opportunity, but it may be attractive enough given the leverage involved in trading Treasury futures. Of course, a tighter stop could also increase the risk/reward closer to 1 to 3 — a popular target for many traders. A similar 1-2-3 trend reversal appears to be developing in the December wheat (WZ2 or WZ02) contract. Note how WZ2 broke down beneath the trendline in early October and then spent the rest of the month rallying from below 366 to just above 412. The consolidation in the second half of October failed to establish a new high, and prices began to decline, breaking back down beneath the trendline and heading for a test of the October low.
Figure 2: A trendline break, followed by a failed attempt to take out the September highs, suggests a 1-2-3 trend reversal setup in December wheat.
Here, one short entry key would have been the rebreaking of the trendline on November 5, during which December wheat closed at 400 6/8. A buy stop in the 412 area would have provided reasonable safety in the event that December wheat made a second rally attempt. Given the measurement implications of the swing rule mentioned, these 12 points of risk would have been more than compensated for by the potential for a 78-point gain. REVERSALS AND THE S&P 500 What does the 1-2-3 trend reversal setup suggest about the current state of the equities markets?
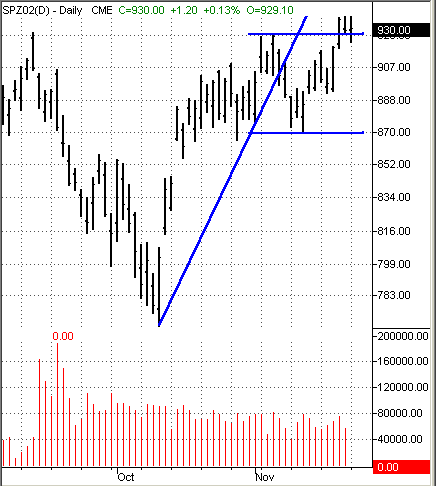
Figure 3: Bull trap, or continuation of the uptrend in the S&P 500? Prudence suggests waiting for a follow-through move or outright collapse beneath resistance.
The first condition, the trendline break, has been met with the decline from November 7 to 11. The market (here the Standard & Poor's 500) found support at 870 and began to rally again in the second half of the month. Meeting the second condition would be a failure of the market to take out the old high of 926.50 set on November 6. However, on November 22, the S&P 500 did just that, with an intraday high of 937.50. If the market holds this higher ground — or better, can follow through with a higher succeeding close — then it is likely that the mid-October to mid-November consolidation represented a base from which further gains are possible. However, should the S&P 500 reverse itself and close lower — 925 or so — then it could be surmised the October rally in stocks is likely over and that a correction is due. As an aside, given the move above resistance at 925 on November 22, a failure to follow through to higher prices would also mark this upmove as a fairly convincing bull trap. A bull trap (or a bear trap), as Jack Schwager describes it, takes place when prices move briefly above resistance (or below support, in the case of a bear trap) before whipsawing back in the opposite direction. While there are a number of explanations as to why bull and bear traps occur, one of the more common explanations is that stops placed just beyond resistance and support often become targets for scalpers and other very short-term traders. In any event, the importance of letting markets follow through after breaking support or resistance is underscored by the phenomenon of bull and bear traps.
David Penn may be reached at DPenn@Traders.com. SUGGESTED READING Penn, David [2002]. "Livestock's Last Upswing," Traders.com Advantage, November 21. Schwager, Jack D. [1984]. A Complete Guide to the Futures Markets, John Wiley & Sons. Sperandeo, Victor [1991]. Trader Vic — Methods of a Wall Street Master, John Wiley & Sons. _____ [1994]. Trader Vic II — Principles of Professional Speculation, John Wiley & Sons. Weinstein, Stan [1988]. Secrets for Profiting in Bull and Bear Markets, Dow Jones-Irwin. Charts courtesy of TradeStation
Current and past articles from Working Money, The Investors' Magazine, can be found at Working-Money.com.
|
Technical Writer for Technical Analysis of STOCKS & COMMODITIES magazine, Working-Money.com, and Traders.com Advantage.
| Title: | Traders.com Technical Writer |
| Company: | Technical Analysis, Inc. |
| Address: | 4757 California Avenue SW |
| Seattle, WA 98116 | |
| Phone # for sales: | 206 938 0570 |
| Fax: | 206 938 1307 |
| Website: | www.traders.com |
| E-mail address: | DPenn@traders.com |
Traders' Resource Links | |
| Charting the Stock Market: The Wyckoff Method -- Books | |
| Working-Money.com -- Online Trading Services | |
| Traders.com Advantage -- Online Trading Services | |
| Technical Analysis of Stocks & Commodities -- Publications and Newsletters | |
| Working Money, at Working-Money.com -- Publications and Newsletters | |
| Traders.com Advantage -- Publications and Newsletters | |
| Professional Traders Starter Kit -- Software | |
PRINT THIS ARTICLE

Request Information From Our Sponsors
- VectorVest, Inc.
- Executive Premier Workshop
- One-Day Options Course
- OptionsPro
- Retirement Income Workshop
- Sure-Fire Trading Systems (VectorVest, Inc.)
- Trading as a Business Workshop
- VectorVest 7 EOD
- VectorVest 7 RealTime/IntraDay
- VectorVest AutoTester
- VectorVest Educational Services
- VectorVest OnLine
- VectorVest Options Analyzer
- VectorVest ProGraphics v6.0
- VectorVest ProTrader 7
- VectorVest RealTime Derby Tool
- VectorVest Simulator
- VectorVest Variator
- VectorVest Watchdog
- StockCharts.com, Inc.
- Candle Patterns
- Candlestick Charting Explained
- Intermarket Technical Analysis
- John Murphy on Chart Analysis
- John Murphy's Chart Pattern Recognition
- John Murphy's Market Message
- MurphyExplainsMarketAnalysis-Intermarket Analysis
- MurphyExplainsMarketAnalysis-Visual Analysis
- StockCharts.com
- Technical Analysis of the Financial Markets
- The Visual Investor


