HOT TOPICS LIST
- Strategies
- Stocks
- Buy
- Investing
- Brokers
- Psychology
- Interviews
- Accumulate
- Sell
- Hold
- Spotlight
- Websites
- Candlestick Corner
- Gold & Metals
- Options Trading
LIST OF TOPICS
THE CHARTIST
The January Effect
01/21/03 04:06:48 PM PSTby Dennis D. Peterson
Is there some predictability to what will happen in January based on what happens in December?
| Certain events appear to be calendar driven. In one, if January is an up month, the year will be an up year. If January is a down month, then the year will finish down. A corollary is that if December ends up, then the first week of January will be down, and if December ends down, the first week of January will be up. I'll call this tendency the January effect.
WHY JANUARY?What makes January special, among other things, is that in November and December fund managers do a lot of selling to rack up capital losses that will offset their capital gains. If you have a profit to take, then take it in January, since you get to wait a year before you have to pay the tax on it. Typically, a correction occurs in January because of all the profit-taking. But is there really a relationship between the end of December and the beginning of January? To find out, I constructed an indicator that compares the price change of the last two weeks of December to the price changes of the first week of January. As indicator building goes, this was a tedious task. Perhaps other software might be easier (I was using the MetaStock custom building formula), but I would guess only by a little. The first problem is that December 31 doesn't always fall on a weekday. So I adjusted each year to end on the last trading day of the year. I had a similar problem for January because I chose dates that would give me seven or eight trading days into the first part of January, so sometimes that date would be January 9 and sometimes January 10, and so on. I point this out only to alert you to changes you might want to make to the indicator(s).
A LOOK AT THE SLOPEI used the linear regression slope because I wanted to look at the slope of prices. Linear regression is a straight line drawn through data so as to minimize the distances from the line to the datapoints (called curve-fitting). According to the January effect, the linear regression slope of the last two weeks of December is the opposite of the linear regression slope of the first week of January — that is, if the slope of December is positive then January is negative, and if December is negative then January is positive. I chose a 14-day period for the linear regression slope for both December and January, and therefore the January slope contains some of the December influence. You can see the problem. What constitutes the end of December and the beginning of January? Should I go to mid-January? Should I use moving averages or look for a trend, as opposed to linear regression slope? What about a momentum measure instead? Is 14 days right for the period? What about just using seven? Obviously, the January effect can be rather subjective.
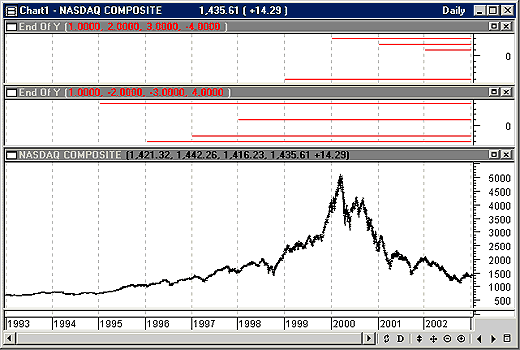
THE RESULTSThe first result (Figure 1) was on the Nasdaq Composite daily price data. I went back eight years — another judgment on my part. I reasoned that over the last eight years the trading community, and in particular the general public, had gained sophisticated tools and data by which to make decisions. I see the January effect, if it exists, as a result of profit-taking following the month when the market, in general, tries to put on a happy face for the holidays (December). It's also perhaps an early time when some market participants choose to sell for capital-loss tax writeoffs. Those events ought to be repeatable.
Figure 1: Daily Nasdaq Composite price data with January effect using linear regression slope. The red horizontal lines in the two charts above the price chart display whether the effect occurred. If positive, then the December and January linear regression slopes are of opposite signs. If negative, then they are of the same sign. By looking down from where the line started, you can see what yearly crossover was tested. For example, the top line in the middle chart plotted at +4, starts at 1994-95 boundary. This means the linear regression slope of the last two weeks of December 1994 is of the opposite sign from the linear regression slope of the first week or so of January 1995.
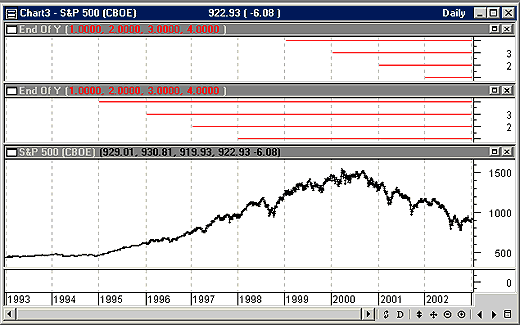
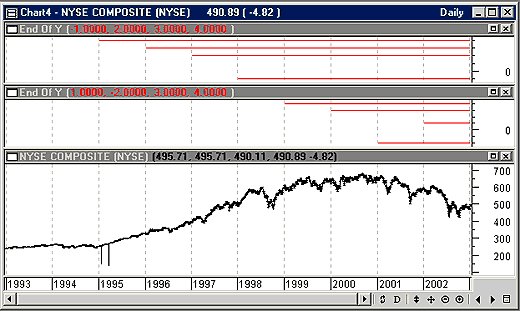
I wrote this indicator so that I could easily replicate statements, rather than use loop statements, which MetaStock does not support. I made each yearly crossover a separate variable so I could see which years worked and which didn't. The result is a series of red horizontal lines, which start at each yearly crossover. The lines are positive (above zero) if December and January have opposite slopes (Figure 1), and negative otherwise. The results show that this method is successful five out of eight times in the last eight years. One more miss, and you are batting .500, which in baseball is terrific but in trading is marginal. What you really want is to bat 1.000, or at least seven out of eight. Maybe this is the wrong index to use. Without a highly reliable measure, all you are left with is that the month of January follows December. Next, I tried the method on the Standard & Poor's 500 (Figure 2). The result took me by surprise: A perfect score. Should I look back a few more years? I was reluctant to do so, since I suspected that going back more than eight years would lessen the effect of the general public's activity. So I tried one more index, the New York Stock Exchange (NYSE) Composite. The result was six out of eight (Figure 3).
Figure 2: S&P 500 daily price data with January effect using linear regression slope. It's a perfect score. The strategy of using linear regression slope is right for the last eight years. Do you need to look back farther, or can you rationalize that the effect is due to improved technology in terms of dataflow and software?
Figure 3: NYSE Composite daily price data with the January effect using linear regression slope. Six out of eight successes is not too bad, as indicated by the six positive horizontal lines in the upper two charts. The same condition for success was used here as in the Nasdaq Composite and S&P 500 examples.
The total score for all three indexes was 19 correct out of 24 tries. However, when I examined one of the failures, it looked like a momentum indicator might have worked. Hence, I tried StochRSI. I would like to see the relative strength index (RSI) at an extreme for every end of December, but that isn't realistic. StochRSI is a terrific momentum oscillator invented by Tushar Chande. The StochRSI might just hit enough of an extreme that I would not be making a decision based on noise. As an oscillator it should be leading, which means if the end of December is above a threshold value, then I expect the first week of January to close up. I also have to make a judgment about the first week, and I decided to use the January dates I created for the linear regression slope test and compare the price of those dates to price five days earlier, declaring success if price is greater than it was five days ago. For the StochRSI threshold I chose 0.4. As I made the final changes to the formula, I noticed that in the 2001 and 2002 crossover for the Nasdaq Composite, the last day of December was down, but prior to that we had an upswing starting on December 21. This last down day caused StochRSI to have a value not much better than noise. Since I needed StochRSI to hit a threshold that is above noise, I allowed for the formula to adjust back from zero to 10 days to remove the last few days of trading and use two days back as the default; that is, to ignore the last two trading days of December. My final setup, therefore, was to declare a success if a 14-day stochastic RSI was greater than 0.4, using the second before last trading day in December, and if price was greater after the seventh or eighth January trading day than it was on the second or third January trading day. If the end of December showed positive momentum, would it carry over into the beginning of January? The answer seems to be no. For the Nasdaq Composite and the S&P 500, the prediction was successful five out of the last eight years, and it worked for the NYSE Composite only three out of eight times, for a total of 13 out of 24. My next thought was to try to optimize around the periods used for the stochastic RSI, or to discount more days at the end of December, or any other of a number of combinations. But this seemed like curve-fitting, which I didn't want to do. Inputting a few numbers into the formulas did improve the score a little (for example, ignore the last three days of trading at the end of December, instead of the last two, and use a seven-day StochRSI).
SUMMARYAt this point I will follow my usual plan, which is to wait for a correction in January and buy on the dip (although the S&P 500 results are tempting). Here is the formula I used to make the linear regression slope comparison for the most recent four years — ignoring the current year. The ValueWhen function allows you to find the nth occurrence of an array, in this case linear regression slope, when an expression is true (in this case a date).
date1:=Year()=2001 AND Month()=12 AND DayOfMonth()=31; date1b:=Year()=2002 AND Month()=1 AND DayOfMonth()=9; date2:=Year()=2000 AND Month()=12 AND DayOfMonth()=29; date2b:=Year()=2001 AND Month()=1 AND DayOfMonth()=9; date3:=Year()=1999 AND Month()=12 AND DayOfMonth()=31; date3b:=Year()=2000 AND Month()=1 AND DayOfMonth()=11; date4:=Year()=1998 AND Month()=12 AND DayOfMonth()=31; date4b:=Year()=1999 AND Month()=1 AND DayOfMonth()=12;
end1:=ValueWhen(1,date1,LinRegSlope(C,14)); end1b:=ValueWhen(1,date1b,LinRegSlope(C,14)); plot1:=If((end1>0 AND end1b<end1) OR (end1<0 AND end1b>end1),1,-1);plot1;
end2:=ValueWhen(1,date2,LinRegSlope(C,14)); end2b:=ValueWhen(1,date2b,LinRegSlope(C,14)); plot2:=If((end2>0 AND end2b<end2) OR (end2<0 AND end2b>end2),2,-2);plot2;
end3:=ValueWhen(1,date3,LinRegSlope(C,14)); end3b:=ValueWhen(1,date3b,LinRegSlope(C,14)); plot3:=If((end3>0 AND end3b<end3) OR (end3<0 AND end3b>end3),3,-3);plot3;
end4:=ValueWhen(1,date4,LinRegSlope(C,14)); end4b:=ValueWhen(1,date4b,LinRegSlope(C,14)); plot4:=If((end4>0 AND end4b<end4) OR (end4<0 AND end4b>end4),4,-4);plot4
The second four years looks like the first except for the dates:
date1:=Year()=1997 AND Month()=12 AND DayOfMonth()=31; date1b:=Year()=1998 AND Month()=1 AND DayOfMonth()=9; date2:=Year()=1996 AND Month()=12 AND DayOfMonth()=31; date2b:=Year()=1997 AND Month()=1 AND DayOfMonth()=9; date3:=Year()=1995 AND Month()=12 AND DayOfMonth()=29; date3b:=Year()=1996 AND Month()=1 AND DayOfMonth()=10; date4:=Year()=1994 AND Month()=12 AND DayOfMonth()=30; date4b:=Year()=1995 AND Month()=1 AND DayOfMonth()=10;
end1:=ValueWhen(1,date1,LinRegSlope(C,14)); end1b:=ValueWhen(1,date1b,LinRegSlope(C,14)); plot1:=If((end1>0 AND end1b<end1) OR (end1<0 AND end1b>end1),1,-1);plot1;
end2:=ValueWhen(1,date2,LinRegSlope(C,14)); end2b:=ValueWhen(1,date2b,LinRegSlope(C,14)); plot2:=If((end2>0 AND end2b<end2) OR (end2<0 AND end2b>end2),2,-2);plot2;
end3:=ValueWhen(1,date3,LinRegSlope(C,14)); end3b:=ValueWhen(1,date3b,LinRegSlope(C,14)); plot3:=If((end3>0 AND end3b<end3) OR (end3<0 AND end3b>end3),3,-3);plot3;
end4:=ValueWhen(1,date4,LinRegSlope(C,14)); end4b:=ValueWhen(1,date4b,LinRegSlope(C,14)); plot4:=If((end4>0 AND end4b<end4) OR (end4<0 AND end4b>end4),4,-4);plot4
For StochRSI I hit the 20 variable limit, and so it looks a little different, but is basically just a substitution of the above for the first four years back:
adj:=Input("Adjustment EOY",0,10,2); date1:=Year()=2001 AND Month()=12 AND DayOfMonth()=31; date1b:=Year()=2002 AND Month()=1 AND DayOfMonth()=9; date2:=Year()=2000 AND Month()=12 AND DayOfMonth()=29; date2b:=Year()=2001 AND Month()=1 AND DayOfMonth()=9; date3:=Year()=1999 AND Month()=12 AND DayOfMonth()=31; date3b:=Year()=2000 AND Month()=1 AND DayOfMonth()=11; date4:=Year()=1998 AND Month()=12 AND DayOfMonth()=31; date4b:=Year()=1999 AND Month()=1 AND DayOfMonth()=12;
periods:=Input("RSI periods",1,100,14); stochrsi:=(RSI(periods)-LLV(RSI(periods),periods))/(HHV(RSI(periods),periods)-LLV(RSI(periods),periods));
end1:=ValueWhen(1,date1,Ref(stochrsi,-adj)); end1b:=ValueWhen(1,date1b,C); If(end1>0.4 AND end1b>ValueWhen(1,date1b,Ref(C,-5)),1,-1);
end2:=ValueWhen(1,date2,Ref(stochrsi,-adj)); end2b:=ValueWhen(1,date2b,C); If(end2>0.4 AND end2b>ValueWhen(1,date2b,Ref(C,-5)),2,-2);
end3:=ValueWhen(1,date3,Ref(stochrsi,-adj)); end3b:=ValueWhen(1,date3b,C); If(end3>0.4 AND end3b>ValueWhen(1,date3b,Ref(C,-5)),3,-3);
end4:=ValueWhen(1,date4,Ref(stochrsi,-adj)); end4b:=ValueWhen(1,date4b,C); If(end4>0.4 AND end4b>ValueWhen(1,date4b,Ref(C,-5)),4,-4)
Dennis Peterson may be reached at DPeterson@Traders.com. Charts courtesy of MetaStock (Equis International)
Current and past articles from Working Money, The Investors' Magazine, can be found at Working-Money.com.
|
Market index trading on a daily basis.
| Title: | Staff Writer |
| Company: | Technical Analysis, Inc. |
| Address: | 4757 California Ave SW |
| Seattle, WA 98116-4499 | |
| Phone # for sales: | 206 938 0570 |
| Fax: | 206 938 1307 |
| Website: | working-money.com |
| E-mail address: | dpeterson@traders.com |
Traders' Resource Links | |
| Charting the Stock Market: The Wyckoff Method -- Books | |
| Working-Money.com -- Online Trading Services | |
| Traders.com Advantage -- Online Trading Services | |
| Technical Analysis of Stocks & Commodities -- Publications and Newsletters | |
| Working Money, at Working-Money.com -- Publications and Newsletters | |
| Traders.com Advantage -- Publications and Newsletters | |
| Professional Traders Starter Kit -- Software | |
PRINT THIS ARTICLE

Request Information From Our Sponsors
- StockCharts.com, Inc.
- Candle Patterns
- Candlestick Charting Explained
- Intermarket Technical Analysis
- John Murphy on Chart Analysis
- John Murphy's Chart Pattern Recognition
- John Murphy's Market Message
- MurphyExplainsMarketAnalysis-Intermarket Analysis
- MurphyExplainsMarketAnalysis-Visual Analysis
- StockCharts.com
- Technical Analysis of the Financial Markets
- The Visual Investor
- VectorVest, Inc.
- Executive Premier Workshop
- One-Day Options Course
- OptionsPro
- Retirement Income Workshop
- Sure-Fire Trading Systems (VectorVest, Inc.)
- Trading as a Business Workshop
- VectorVest 7 EOD
- VectorVest 7 RealTime/IntraDay
- VectorVest AutoTester
- VectorVest Educational Services
- VectorVest OnLine
- VectorVest Options Analyzer
- VectorVest ProGraphics v6.0
- VectorVest ProTrader 7
- VectorVest RealTime Derby Tool
- VectorVest Simulator
- VectorVest Variator
- VectorVest Watchdog


