HOT TOPICS LIST
- Strategies
- Stocks
- Buy
- Investing
- Brokers
- Psychology
- Interviews
- Accumulate
- Sell
- Hold
- Spotlight
- Websites
- Candlestick Corner
- Gold & Metals
- Options Trading
LIST OF TOPICS
TRADER'S NOTEBOOK
Most Of What You Need To Know About Technical Analysis
02/04/03 02:46:48 PM PSTby Matt Blackman
. . . You learned in elementary school.
| Technical analysis seeks to explain price movements and determine probabilities for similar future movements. There are hundreds of technical indicators and chart patterns, but the most basic are often the best. This article will look at the essentials of technical trading and why market players can't afford to overlook the basics.
FIRST STEPSNew traders are frequently overwhelmed with all the information available on technical trading. With so much to learn, where is the best place to start? There are dozens of books on the subject, and hundreds of websites that cover everything from simple swing trading to complex systems combining indexes and securities. Many authors claim that they have found "the" best system. But any system for trading stocks, commodities, or options should not be overly complex. In many cases, the more complicated the system, the less likely it is to work. Many traders spend months trying to build new and intricate systems, only to realize it is essential to keep things simple. To find a system that works, it is important to understand what technical analysis is all about. According to analyst Martin Pring, technical analysis seeks to identify trends that are based on the changing attitudes of investors towards news and other fundamental events. Historically, these events have sometimes led to chart patterns or specific relationships between high, low, opening, and closing prices. Statistically speaking, there is a probability that similar relationships (chart patterns) will lead to similar outcomes (price movements) in the future. As technical analyst and author John J. Murphy commented:
Technical analysis does not have to be complicated. Look at a line on a chart. If it's going up, that's good. If it's going down, that's bad. The problem is that most people can't tell the difference.
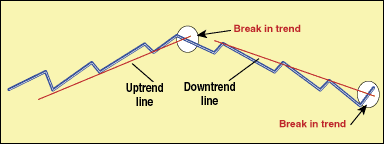
WHAT TECHNICAL TRADING ISN'TThree initial challenges face neophytes. The first is to realize that trading using technical analysis or other means is not a guaranteed road to riches. There is no holy grail to trading, and anyone who tells you otherwise is lying. Developing a system that is profitable takes a lot of time, thought, and no small amount of skill. Like anything else worthwhile in life, there are no shortcuts to success. This means that you will not find a ready-made system that you can trade and make consistent profits from right out of the box. It takes time and effort to build a system that works, and it must be customized to your risk tolerance and to the personality of each chosen security. Second, keep in mind that trading is not risk-free. There can be no big wins without some relatively big losses. With luck and by following shrewd money management principles, hopefully the big gains will come before the big losses, but that depends on the markets and your skill level. Sooner rather than later you will lose, and the bigger the stakes, the bigger the loss. This is why so many veterans preach the importance of strict stop-losses. Third and finally, no trade is a sure thing. Many newcomers have a hard time grasping the difference between probability and certainty. Because a triple-top chart pattern led to price declines in the past, for example, does not guarantee that prices will decline the next time the same pattern occurs — only that there is a probability that they will. Those who wish to use technical analysis to trade successfully must accept that they are building a system based on the law of averages or percentages. If the probability of prices dropping after a triple-top chart pattern is better than 50%, it is possible to make money using a system that generates a trade after such a pattern has occurred. If enough trades are entered and strict money management is used to limit the downside, the system should make money. It does not take a degree in statistics or mathematics to understand these relationships. Learning to identify patterns and develop an understanding of the (in most cases) simple arithmetic behind the indicators you wish to employ is far more important. Take identifying a trend, for example. If it is as simple as drawing a line and deciding if it is going up or down, why do so many find the exercise so difficult? The math is relatively easy. Looking at a 60-day trend, if the close today is greater than the close 60 days ago and a straight line between the two along the bottom of the price chart slants upward, the trend is up. The rate of change between the two periods is simply a matter of subtracting the earlier close from the later and multiplying your answer by 100 to get a percentage change. The higher the percentage change, the steeper the slope of the line and the trend. An uptrend is simply a series of higher highs and higher lows in sequence. Connect the series of higher lows with a line to determine which way the trend is headed. An uptrend develops when at least two higher lows touch the trendline. Where the price penetrates the trendline, the trend is said to have been broken (see Figure 1).
Figure 1: A security price showing two trends.
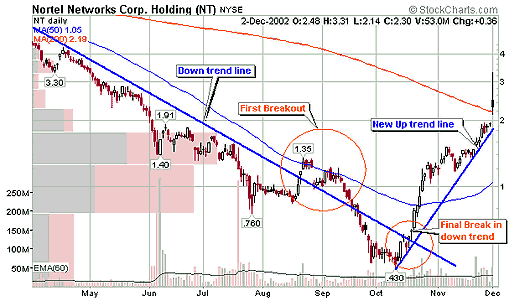
A downtrend is a series of lower highs and lower lows. It is identified by drawing a line along the series of lower highs where the highs touch the trendline in at least two, but ideally three, places. Drawing both lines is a simple matter of connecting the dots. Like all chart patterns, a trend is a battle between buyers and sellers, which is why securities rarely move in a straight line. Prices go up when buyers are more aggressive, and down when sellers become fearful that premium prices will not hold. The ultimate movement in price is determined by which side wins each battle. The longer each battle, the more reliable it is in helping the technical analyst determine the probable outcome. Ask any experienced technical analyst or trader how many of the hundreds of indicators they use on a regular basis, and invariably you will hear the same response. Every one of them has a favorite short list of four or five indicators, depending on the type of trading activity in which they engage. But they all rely heavily on trend analysis, for that is the foundation of technical analysis. I recently had the pleasure of attending a seminar presentation by Phil Roth, one of the earliest recipients of the Chartered Market Technician (CMT) designation and a pioneer of technical analysis. He does not rely on stochastics or any of the other momentum indicators, but rather monitors price and volume to determine the strength of the trend. He drew a diagram similar to Figure 1. A trend is alive until it breaks its trendline. When the break in trend has been confirmed, it is time to exit the trade. The challenge is that there is no strict time limit to define a trend. A daytrader might consider a trend to be 10 minutes long if he is trading tick by tick using intraday data. An investor might require months of data to reach the same conclusion, which explains why traders and investors have differing opinions of trend. Generally, the longer the trend, the more reliable it is as a trading tool (see Figure 2).
Figure 2: Nortel Networks (NT). Example of a stock in a trend. The first breakout warned of a possible change in trend, and the final break confirmed it.
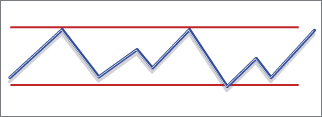
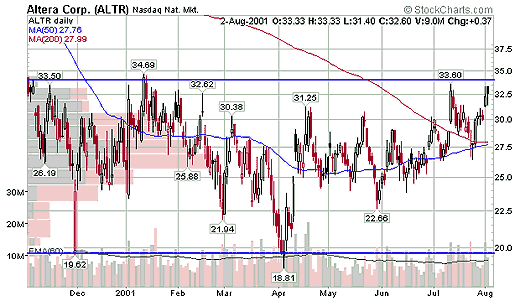
Once you master the concept of trend, it is important to look at some basic chart patterns. There are two types of patterns: reversals and continuation or consolidation patterns. Continuation or consolidation patterns are pauses in the dominant trend after which the security will continue moving in the direction of the trend. In Figure 3 you see a diagram of a security that is range-bound, or in a trading range. The chart of Altera (ALTR) displayed in Figure 4 is an example of a stock stuck in a trading range. Reversal patterns, as the name implies, are those warning of a change in the direction of the trend. The triple top mentioned is an example of a reversal pattern.
Figure 3: Range-bound or in a trading range. When there is no trend, oscillators such as stochastics, relative strength, and the commodity channel indexes are useful in range-bound or trading-range situations. Relying on them in a trend without realizing their limitations can lead to serious losses.
Figure 4: Altera Corp. (ALTR) stuck in a trading range. Note the movement on the right side of the chart. Prices move above the 50- and 200-day moving averages, signaling the beginning of a possible uptrend.
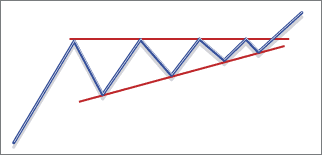
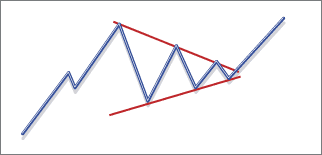
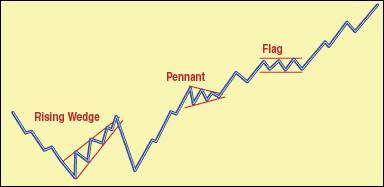
CONTINUATION PATTERNSContinuation patterns are important because they often catch traders and investors offside who believe that the trend has reversed. If volume declines over the duration of the pattern, chances are good that a continuation pattern is unfolding. Some examples of continuation patterns are descending triangles (Figure 5), ascending triangles (Figure 6), symmetrical triangles (Figure 7), wedges, pennants, and flags (Figure 8).
Figure 5: Descending triangle
Figure 6: Ascending triangle
Figure 7: Symmetrical triangle
Figure 8: Pennant, rising wedge, and flag patterns
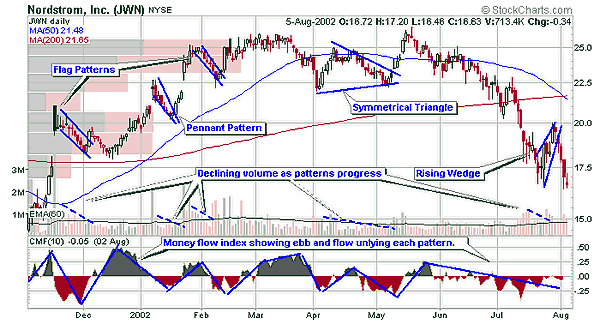
The Chaikin money flow indicator measures the degree of buying or selling pressure based on the relationship between the close and the high or low over a given period. On the chart of Nordstrom, Inc. (JWN), in Figure 9, notice that after each runup in price, there is profit-taking through each one of the continuation patterns. Investors who have made profits are selling, and new investors who see an opportunity to get in at lower prices jump on board, propelling the stock to new highs. Eventually (toward the end of May), the rally runs out of steam and new money is no longer coming in.
Figure 9: Nordstrom, Inc. (JWN). Here you see the flag, pennant, symmetrical triangle, and rising wedge patterns complete with telltale declining volumes.
Understanding what is going on in the minds of investors and what motivates them through each pattern helps market players understand why the various patterns work. Volume provides us with a three-dimensional look at buying activity. When it does not support the pattern, it can also provide an early warning of a change in investor sentiment and a breakdown or reversal from the expected outcome. For example, if volume continues to build instead of drop through a downward flag or pennant pattern so volume increases as price decreases, the pattern is bearish. This means that an expected price bounce at the end of the pattern will not occur, or it will be short-lived. For this reason, volume ebbs and flows must be considered when looking for reliable chart patterns.
CONCLUSIONPatterns such as flags, pennants, and triangles are not new. We learned to recognize them in elementary school. The same holds true for the simple arithmetic behind many of the indicators. Just learning the various technical analysis patterns or indicators may seem daunting enough to the newcomer, let alone determining the principles behind them. However, taking the time to learn how they work makes it much easier to understand when to use them.
Matt Blackman is a trader, technical analyst, software and book reviewer, and a content provider for www.thechartmaster.com. He can be reached at matt@goldhaven.com. He lives in Vancouver, BC.
SUGGESTED READINGMurphy, John J. [1999]. Technical Analysis Of The Financial Markets, New York Institute of Finance.Murphy, John [2001]. Online Trading Summit Cast Audio/Visual CD, Equis International. Pring, Martin [2002]. Technical Analysis Explained, McGraw-Hill. Wilkinson, Chris [1997]. Technically Speaking: An Interview with Philip J. Roth, Traders Press. Charts provided by: Stockcharts.com
Current and past articles from Working Money, The Investors' Magazine, can be found at Working-Money.com.
|
Matt Blackman is a full-time technical and financial writer and trader. He produces corporate and financial newsletters, and assists clients in getting published in the mainstream media. He tweets about stocks he is watching at www.twitter.com/RatioTrade Matt has earned the Chartered Market Technician (CMT) designation.
| E-mail address: | indextradermb@gmail.com |
PRINT THIS ARTICLE

Request Information From Our Sponsors
- StockCharts.com, Inc.
- Candle Patterns
- Candlestick Charting Explained
- Intermarket Technical Analysis
- John Murphy on Chart Analysis
- John Murphy's Chart Pattern Recognition
- John Murphy's Market Message
- MurphyExplainsMarketAnalysis-Intermarket Analysis
- MurphyExplainsMarketAnalysis-Visual Analysis
- StockCharts.com
- Technical Analysis of the Financial Markets
- The Visual Investor
- VectorVest, Inc.
- Executive Premier Workshop
- One-Day Options Course
- OptionsPro
- Retirement Income Workshop
- Sure-Fire Trading Systems (VectorVest, Inc.)
- Trading as a Business Workshop
- VectorVest 7 EOD
- VectorVest 7 RealTime/IntraDay
- VectorVest AutoTester
- VectorVest Educational Services
- VectorVest OnLine
- VectorVest Options Analyzer
- VectorVest ProGraphics v6.0
- VectorVest ProTrader 7
- VectorVest RealTime Derby Tool
- VectorVest Simulator
- VectorVest Variator
- VectorVest Watchdog

