HOT TOPICS LIST
- Strategies
- Stocks
- Buy
- Investing
- Brokers
- Psychology
- Interviews
- Accumulate
- Sell
- Hold
- Spotlight
- Websites
- Candlestick Corner
- Gold & Metals
- Options Trading
LIST OF TOPICS
FOCUS ON
Precious Metals Pullback
03/25/03 04:07:27 PM PSTby David Penn
Let's look back on the first leg of the secular bull market in precious metals.
| On the nature of what he refers to as "first waves," Elliott wave theorist Robert Prechter notes:
In contrast to the bear market rallies within the previous decline, however, this first wave rise is less emotional and technically more constructive. Plenty of selling, including short selling, is in evidence as the majority has finally become convinced that the overall trend is down. Elsewhere, he adds that the initial surge upward in a new bull market is characterized by a "rebound from low valuation" and an anxious "recognition of survival." Whether or not you subscribe to the Elliott wave approach to market analysis, the methodology is unarguably helpful in discussing the changes in psychology that accompany (or even support or sponsor) market moves. As such, this psychological "tracking" can be used much like any other sentiment indicator to help traders and investors determine just where they are in a bull or bear market. The two-year-old advance in precious metals (particularly in gold) provides an excellent opportunity for studying what many believe is the beginning of a new secular bull market. This is especially so, as this new secular bull market experiences what appears to be its first major correction. If the psychology of "first waves," or the initial move upward in a new bull market, remains fragile, anxious, and tentative, then the first correction (the "second wave" in Elliott wave parlance) should present an interesting challenge to those who took the risk that the first move up was indeed representative of a secular changing of the guard from bear to bull. For clarity's sake, here is Prechter on "second waves":
Second waves often retrace so much of wave one that most of the profits gained up to that time are eroded away by the time it ends . . . Investors have finally gotten "one more rally to sell on" and they take advantage of it. And elsewhere, he refers to this correction as a "test of lows," in which "fundamental conditions (are) often as bad as or worse than those at the previous bottom. Underlying trend (is) believed to be down." While it is true that the average retail investor has yet to really "wake up" to gold, it is equally true that a number of informed investors have become extremely bullish on precious metals — again, with an emphasis on gold. This is underscored both by the tremendous rise in the price of gold since its bottom in the spring of 2001, as well as in the bullishness of such unhedged gold indexes as the Gold Bugs Index ($HUI) since its bottom late in autumn 2000. But the absence of mass participation in gold's advance from $268 an ounce in April 2001 to $384 an ounce in February 2003 (basis continuous futures) and the apparent paradox of gold sentiment being both passionate (among informed investors) and largely indifferent (among average retail investors) should not come as a great surprise. Prechter observes that it is generally not until the third wave that mass participation truly starts to play a role in a market advance (with mass participation being almost the dominant characteristic of the final, ecstatic fifth wave). And the fact that the Commitment of Traders reports on futures positions has consistently shown both large long positions among informed, large speculators as well as even larger short positions among equally well-informed commercial hedgers only underscores the duality often at work in the early stages of bull markets.
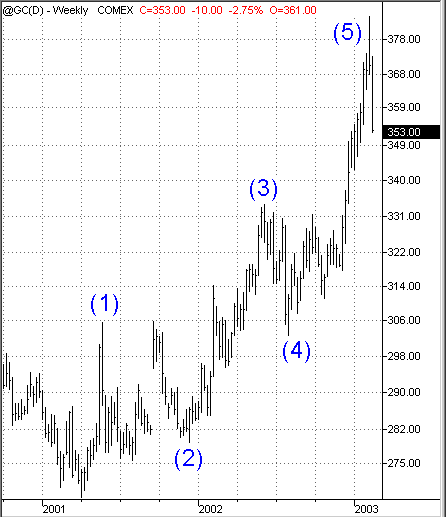
THE WAVE THAT WASThe evidence is compelling that the bull market in precious metals that began between the autumn of 2000 and the spring of 2001 has ended. Significant corrections in the weekly charts of continuous gold futures, the Goldman Sachs Precious Metals Index, continuous silver futures, and the Gold Bugs Index occurring in February 2003 all seem to support this conclusion. Here, I will use a combination of Elliott wave theory and Fibonacci projections as well as other tools such as trend channels to further make the point that a sizable retracement in precious metals is at hand. Looking first at the weekly continuous gold futures, I note a five-wave sequence that begins with a wave 1 peak at 305 in May 2001, a wave 2 trough at 280 in December 2001, a wave 3 peak at 334 in June 2002, a wave 4 trough in August 2002, and a wave 5 peak in February 2003.
Figure 1: These five waves appear to represent the first major leg up in gold's secular bull market.
Robert Fischer, in his Fibonacci Applications And Strategies For Traders, presents an interesting Fibonacci-based method for anticipating the end of the fifth wave in an Elliott five-wave sequence (see my Traders.com Advantage piece, "Fibonacci and Fifth Waves," February 11, 2003, for another application of Fischer's observations). Fischer suggests multiplying the extent of the first wave in the sequence by the Fibonacci ratio of 1.618, and then adding that number to the value at the top of the first wave. A companion method that Fischer introduces calls for multiplying the amplitude of the third wave (end of wave 3, less value at the beginning of wave 1) times the same Fibonacci ratio — this time expressed as 0.618, and then adding that number to the value at the end of the third wave. Either method is geared toward giving the Elliott wave-based trader a target for the end of the fifth wave. Fischer disagrees with those Elliotticians (including Ralph Nelson Elliott himself) who believe that the five-wave sequence alone can be used to accurately predict the end of the fifth wave. For me, I use Fischer's method to anticipate a range between which the fifth wave is likely to end or, more specifically, a range within which the risks of the fifth wave ending increase significantly. Thus, applying Fischer's method to the weekly chart of continuous gold futures provides the following:
Method 1 Length of wave 1: 305 268 = 37 37 x 1.618 = 59.866 305 + 59.866 = 364.866
Method 2 Amplitude of wave 3: 334 268 = 66 66 x 0.618 = 40.788 334 + 40.788 = 374.788
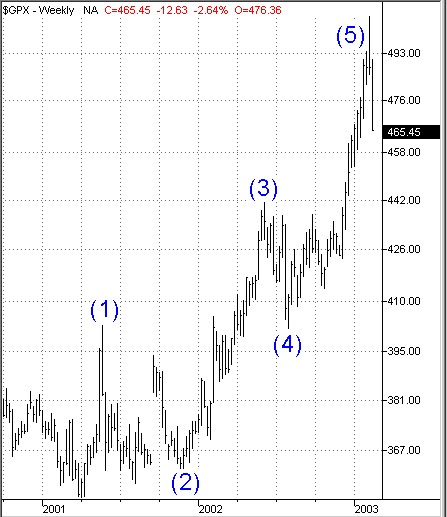
The target range for the end of the fifth wave in continuous gold futures, then, is 365 -375. Looking back to the gold futures (Figure 1), we note that gold (again, as measured by continuous futures) topped out on an intraweek basis at 384.50. The close of that week, however, was 370.50, almost perfectly within the range suggested by Fischer's method. Similar calculations with the $HUI and the Goldman Sachs Precious Metals Index also do a remarkable job of anticipating the end of fifth waves. With the Gold Bugs Index, I used only the first of the two methods because I believe that a bull market failure caused the peak of wave 5 to stop at about the same level as the peak of wave 3. While there are quite possibly alternative counts that support a different conclusion, the compatibility between the wave count of the Gold Bugs Index and that of other gold-related indices and stocks is such that I feel that a bull market failure call on the $HUI is a reasonable position to take. Here is the example of the Goldman Sachs Precious Metals Index:
Figure 2: The Goldman Sachs Precious Metals Index correlates strongly with the price movements of gold.
Method 1 Length of wave 1: 402 354 = 48 48 x 1.618 = 77.664 402 + 77.664 = 479.664
Method 2 Amplitude of wave 3: 441 354 = 87 87 x 0.618 = 53.766 441 + 53.766 = 494.766
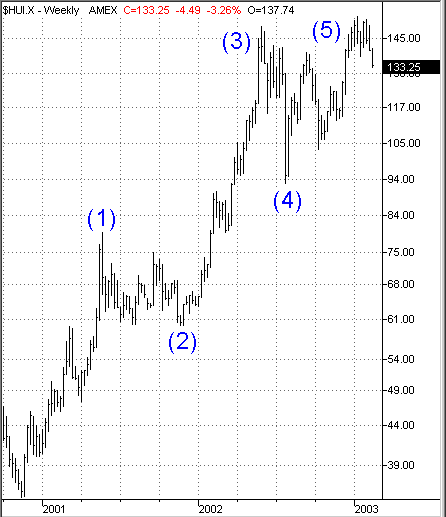
The target range for the fifth wave in the Goldman Sachs index is 480 to 495. The intraweek top was 507. However, the week of the peak closed at 487.80, again within the target range. Here is the somewhat more complex situation of the Gold Bugs Index. Again, I use only the first method because I consider this to be a bull market failure in which the fifth wave does not move above significantly above the peak of the third wave.
Figure 3: The AMEX Gold Bugs Index experiences a bull market failure, which ends its bull market in 2003.
Method 1 (only) Length of wave 1: 80 35 = 45 45 x 1.618 = 72.81 72.81 + 80 = 152.81
Here, note that the Gold Bugs Index topped out on an intraweek basis at 154.92. The close of that week was 147.91.
RETRACEMENTS AND THE RIDE DOWNSo if the end of these bull markets (or, perhaps more accurately, the end of the first leg of these bull markets) has been all but established, what can be anticipated in the way of a correction? There are three major retracement levels suggested by Fibonacci analysis: a 38.2% retracement, a 50% retracement, and a 61.8% retracement. While both the 38.2% and 61.8% are more exotic, reflecting as they do Fibonacci ratios 0.382 and 0.618, the 50% retracement level is quite commonplace. The 50% retracement level also resonates strongly with Dow theory traders. As Richard Russell of Dow Theory Letters notes:
. . . [W]hat a major average does (I use the Dow) at the 50% or halfway level of a major advance or decline is critically important . . . If, on a decline, the Dow can retain 50% of the ground gained on the preceding advance — that's a bullish situation, and often leads to a test of the highs again. On the other hand, if the decline wipes out more than half of the preceding advance, that's a bearish situation and the Dow will usually go a good deal lower. From an Elliott wave perspective, market corrections tend toward the following pattern in terms of the extent of any retracement:
The rule is that corrections, especially when they themselves are fourth waves, tend to terminate within the span of travel of the previous fourth wave correction of one lesser degree, most commonly near the level of its terminus. As you might imagine, there are exceptions to this rule, particularly when extensions are involved:
However, in a slight modification of the rule, it is often the case that if the first wave in a sequence extends, the correction following the fifth wave will have as a limit the bottom of the second wave of lesser degree, as might be logically expected. Elsewhere, Robert Prechter has noted in his review of market manias that it is often the case the correction leaves the market lower than it was when the mania began. So while there is a significant amount of variation when it comes to Elliott wave methodology and corrections, some guidelines can be used in concert with some of the above-mentioned retracement strategies. As an example, let's return to the chart of weekly continuous gold futures. The bull market began in spring 2001 at 268 and ended early in 2003 with an intraweek high of 384 and a weekly close of 370. Because of the "shooting star" top and the difference between the intraweek high and the weekly close, I will use a retracement range instead of a specific retracement point:
38.2% retracement 340 331
50% retracement 326 319
61.8% retracement 312 307
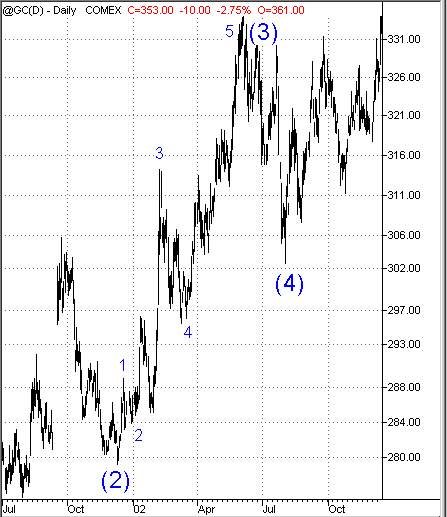
This encompasses both the Dow theory retracement level as well as those suggested by Fibonacci ratios. But do any of these levels correspond as well with those retracement levels produced by Elliott wave analysis? Let's take a closer look at how the Elliott wave retracement works. First, find the fourth-wave trough from Figure 1 at about 303. Then look for the previous wave 4 of one lesser degree. The "wave four of one lesser degree" is marked as "4" at about 297.
Figure 4: The wave 4 correction reaches a trough low just above the trough low of the wave 4 correction marked (4) — the "wave 4 of one lesser degree."
What does this say about the correction of the larger move from 268 to 370/384? If the larger move is considered to be a five-wave advance of primary 1 degree, then a primary-level correction (a primary 2 decline) could be expected to find a trough low at the trough of wave 4 (about 303) from the previous primary 1 level advance. This is just outside the lower end of the 61.8% retracement range of 312-307 noted above. One way to account for this "overshooting" on the downside may be to look at the various minor trough lows between the bottom of wave (4) and the beginning of the year. In Figure 4, the wave (4) trough low does not quite reach the level of the trough low from wave 4. This may be because of support provided by the minor trough lows between the bottom of wave (4) and the bottom of wave 4. In fact, it appears as if wave (4) found support in the minor trough low in April, immediately after the wave 4 trough low. Similarly, it is possible that any correction going forward might not fall as far as the wave (4) trough low of 303, and might instead find support among one of the minor trough lows that develop afterward, such as the low at 308 or even the low at 311.
ONLY A WAVE AWAY?The bull market in precious metals from 2001 to 2003 — again, particularly in gold — was probably the first salvo in a secular campaign that could see the group move to heights that would have been hard to imagine as recently as five years ago. It is important to note, however, this is very much in the nature of new bull markets. The popular refrain about bull markets is that they climb a "wall of worry": time and time again they prove the doubters and the cynics wrong until, finally, the doubters and the cynics capitulate and decide they would rather join the party than sneer and point fingers from outside. Many of the dynamics of nascent bull markets have been lost on investors and traders who grew accustomed to the bull market in stocks in the 1980s and 1990s. But even a cursory reading through financial publications of the early 1980s — even as late as 1983-84 — reminds us that most people remain skeptical of bull markets almost until the very end, when the stampede of new investors who had been watching prices rise (however fitfully at times) finally decide to join in. Just such a stampede could be in the making on the other side of the correction anticipated here, a correction that could take the price of gold dangerously close to the 300 level, and see the Gold Bugs Index drop back into the level it was at in the mid-1990s. There is no doubt that if the correction moves to these extents, those who had doubted the bull market all along will suddenly feel vindicated and waste little time in reminding broken-hearted gold investors about how lousy an investment in gold has been for the past 20 years. If there is a simultaneous rally in another asset class — say, a good, old-fashioned, major bear market rally in stocks — then the antigold recriminations will probably be all the more vociferous, arrogant, and loud. Old traders and investors often remark that the hardest part of trading and investing is the waiting — and those looking for gains on the long side of gold may find their ability to wait out a sizable correction severely tested in the weeks and months to come. They will most likely feel kinship with those stock market bulls in 1977 and 1982, whose equity purchases in the previous year were starting to look less prescient and more, at a minimum, premature. But hopefully, they will find themselves feeling about gold the way William O'Neil, founder of Investors Business Daily, felt about stocks when he purchased full-page Wall Street Journal advertisements in 1978 and again in 1982, exhorting anxious bulls to keep the faith:
"But remember that the market started down when people were optimistic, and it will start back up when most people are pessimistic. The market will discount and look ahead 8 to 9 months. By the time economists decide whether or not we are in a recession, the new bull market will be underway. And the biggest profits from any bull market are usually made by those who recognize it first. So those who fail to grab the bull by the horns will wind up on the tail end."
David Penn may be reached at DPenn@Traders.com.
SUGGESTED READINGFischer, Robert [1993]. Fibonacci Applications And Strategies for Traders, John Wiley & Sons.Frost, A.J., and Robert R. Prechter Jr. [1978]. Elliott Wave Principle, New Classics Library. O'Neil, William J. [1995]. How To Make Money In Stocks, 2 nd ed., McGraw-Hill. Penn, David [2003]. "Fibonacci And Fifth Waves," Traders.com Advantage: February 11. Prechter, Robert R. [1995]. At The Crest Of The Tidal Wave, John Wiley & Sons. Russell, Richard [2002]. "Richard Russell on the Markets," Dow Theory Letters: December 9. TradeStation
Current and past articles from Working Money, The Investors' Magazine, can be found at Working-Money.com. |
Technical Writer for Technical Analysis of STOCKS & COMMODITIES magazine, Working-Money.com, and Traders.com Advantage.
| Title: | Traders.com Technical Writer |
| Company: | Technical Analysis, Inc. |
| Address: | 4757 California Avenue SW |
| Seattle, WA 98116 | |
| Phone # for sales: | 206 938 0570 |
| Fax: | 206 938 1307 |
| Website: | www.traders.com |
| E-mail address: | DPenn@traders.com |
Traders' Resource Links | |
| Charting the Stock Market: The Wyckoff Method -- Books | |
| Working-Money.com -- Online Trading Services | |
| Traders.com Advantage -- Online Trading Services | |
| Technical Analysis of Stocks & Commodities -- Publications and Newsletters | |
| Working Money, at Working-Money.com -- Publications and Newsletters | |
| Traders.com Advantage -- Publications and Newsletters | |
| Professional Traders Starter Kit -- Software | |
PRINT THIS ARTICLE

Request Information From Our Sponsors
- VectorVest, Inc.
- Executive Premier Workshop
- One-Day Options Course
- OptionsPro
- Retirement Income Workshop
- Sure-Fire Trading Systems (VectorVest, Inc.)
- Trading as a Business Workshop
- VectorVest 7 EOD
- VectorVest 7 RealTime/IntraDay
- VectorVest AutoTester
- VectorVest Educational Services
- VectorVest OnLine
- VectorVest Options Analyzer
- VectorVest ProGraphics v6.0
- VectorVest ProTrader 7
- VectorVest RealTime Derby Tool
- VectorVest Simulator
- VectorVest Variator
- VectorVest Watchdog
- StockCharts.com, Inc.
- Candle Patterns
- Candlestick Charting Explained
- Intermarket Technical Analysis
- John Murphy on Chart Analysis
- John Murphy's Chart Pattern Recognition
- John Murphy's Market Message
- MurphyExplainsMarketAnalysis-Intermarket Analysis
- MurphyExplainsMarketAnalysis-Visual Analysis
- StockCharts.com
- Technical Analysis of the Financial Markets
- The Visual Investor


