HOT TOPICS LIST
- Strategies
- Stocks
- Buy
- Investing
- Brokers
- Psychology
- Interviews
- Accumulate
- Sell
- Hold
- Spotlight
- Websites
- Candlestick Corner
- Gold & Metals
- Options Trading
LIST OF TOPICS
THE CHARTIST
Profit/Loss Curves
04/01/03 04:03:54 PM PSTby Rudy Teseo
Can you manage your option contracts without these curves?
| Many things in life amaze me. One of them is finding out that there are people who trade the more complex options strategies without the use of profit/loss diagrams to aid in the planning and subsequent monitoring of their contracts. These profit/loss curves (also referred to as cost/profit or risk/reward diagrams) are line charts that show the change in premium value with the constantly changing movement of the underlying instrument (stock, index, or commodity).
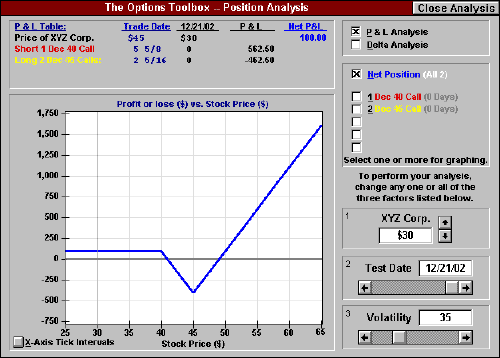
PROFIT/LOSS CURVEThe reason many option traders do not use option-strategy diagrams may be because many of the textbooks on option trading do not even mention these diagrams. In his book Options As A Strategic Investment, Lawrence McMillan does an excellent job of explaining each option strategy with reference to its profit/loss curve, as well as in table form. On the other hand, The Complete Option Player by Kenneth R. Trester (a real bible of option trading), as well as other books on getting started in options, are text only — no curves. As a result, many investors start trading options without this useful and necessary knowledge. A handy booklet of 21 option strategy diagrams with full explanations of each strategy is available free from the Chicago Mercantile Exchange (CME). (See references at the end of this article.) Each strategy is illustrated to demonstrate the effect of time decay on the total option premium involved in the position, as well as describe each leg of the option and the purpose of the specific strategy. These option-strategy diagrams are industry standards, and are actually minirepresentations of the curves at expiration that are graphed during a strategy analysis in the Black-Scholes option pricing model. Figure 1 is a screen shot of a Black-Scholes analysis of a call ratio backspread. The Chicago Board Options Exchange (CBOE) offers a free Black-Scholes option pricing calculator. (See references.) The Coffee, Sugar, Cocoa Exchange (CSCE) lists 26 strategies that they trade, so there may be even more out there.
Figure 1: Black-Scholes analysis. Here you see an analysis of the call ratio backspread.
The first time I passed this booklet around at an option group meeting, there were comments like, "Wow, 21 strategies! When do you use which?" That's a very good question. In his latest book, Profit With Options, Lawrence McMillan devotes several chapters to the crucial role that implied volatility plays in determining the best option trading strategy. The following from his book will serve as an introduction to the strategy I am going to discuss. Volatility skewing refers to the fact that most option markets display different implied volatilities at different strike prices of the same underlying, even though they expire at the same time. Positive or forward skewing occurs when the implied volatility increases as the strike price increases. This is common in the commodities market. Negative or reverse skewing occurs when the implied volatility decreases as the strike price increases. This is common in the index markets: OEX and SPX, notably. McMillan suggests that a call ratio spread or a put backspread be traded in a positive-skewed situation, whereas in a negative-skewed situation, a put ratio spread or a call backspread should be traded.
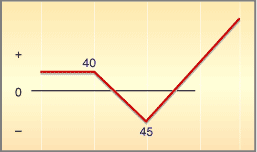
MEASURING VOLATILITY SKEWI spent several hours with a Black-Scholes model analyzing dozens of IBM puts and calls at various strike prices and expiration dates to produce a list of strike prices versus implied volatility. I satisfied myself that IBM, at least, was exhibiting reverse skew. It acted more like an index than a commodity. So the choices were a put ratio spread or a call backspread. Which is better? Studying my booklet told me that the put ratio spread had unlimited risk/limited profit, whereas the call backspread had limited risk/unlimited profit. Which would you choose? This shouldn't be your only consideration, however. If you think there is a greater probability of your stock going down than up, then you might do better gambling on the bearish put ratio spread. You enter a call ratio backspread by selling a call at a lower strike and buying two calls at a higher strike. Figure 2 is the cost/profit diagram of this strategy showing the strike prices. This trade is normally entered as a credit transaction. This means that you have to receive more for your short call than you pay for your long calls. You might accomplish this by selling an in-the-money (ITM) call and buying two at-the-money (ATM) calls, or selling an ATM call and buying two out-of-the-money (OTM) calls. You must determine this from the options offered. For this example, I'll use the values from Figure 1. I sold a call for $5.62 and bought two calls at $2.31 each. This resulted in a credit transaction of $1 ($100 per contract).
Figure 2: Cost/profit diagram of call ratio backspread. This strategy involves selling a call at a lower strike and buying two calls at a higher strike.
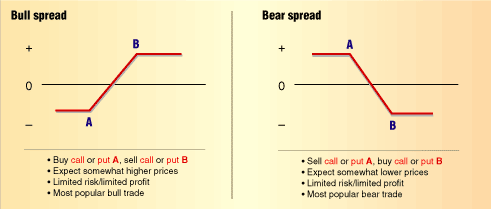
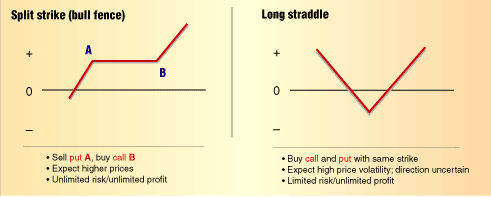
How would you know what was happening without this diagram? Note on the diagram, however, as the underlying moves higher or lower along the horizontal axis, you can see the immediate changes in the premium value as it rises or falls along the curve. You can see that even if the underlying sinks with all hands and all options expire worthless you will profit by the credit, which is $100. This can be seen in Figure 1 with the price at expiration at $30 and the net profit/loss at $100. The maximum loss (limited risk, remember) occurs at expiration at the strike of the long calls, which is equal to BA (4540) minus the credit (1) = $400. But if the underlying takes off, the profit is unlimited. Simple strategies like a long call or a long put can probably be managed without the use of cost/profit curves. But there are only four simple one-leg strategies: long call, long put, short call, short put. The other 17 certainly need more than a mental picture. Figure 3 displays six popular strategies with their rationales.
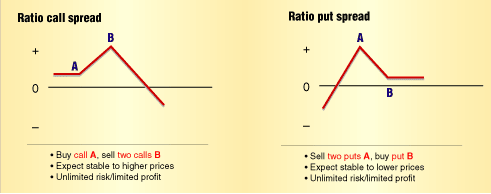
Figure 3: Option cost/profit curves. Here you see six popular options strategies: bull spread, bear spread, split strike, long straddle, ratio calendar spread, and ratio put spread.
Rudy Teseo is a private trader and has taught classes in option trading and the basics of stock charting. He can be reached at rftess@juno.com.
SUGGESTED READINGCBOE 800 678-4667 — Ask for the Options Toolbox Kit.CME 888 252-6464 — Ask for the Mini S&P 500 Options Kit. McMillan, Lawrence G. [1993]. Options As A Strategic Investment, New York Institute of Finance. _____ [2002] Profit With Options, John Wiley & Sons. Trester, Kenneth R. [1998]. The Complete Option Player, Institute for Options Research.
Current and past articles from Working Money, The Investors' Magazine, can be found at Working-Money.com.
|
Rudy Teseo is a private investor who trades stocks, options, and currencies. He has taught classes in technical analysis and option trading. He may be reached at rftess@optonline.net.
| E-mail address: | rftess@optonline.net |
PRINT THIS ARTICLE

Request Information From Our Sponsors
- StockCharts.com, Inc.
- Candle Patterns
- Candlestick Charting Explained
- Intermarket Technical Analysis
- John Murphy on Chart Analysis
- John Murphy's Chart Pattern Recognition
- John Murphy's Market Message
- MurphyExplainsMarketAnalysis-Intermarket Analysis
- MurphyExplainsMarketAnalysis-Visual Analysis
- StockCharts.com
- Technical Analysis of the Financial Markets
- The Visual Investor
- VectorVest, Inc.
- Executive Premier Workshop
- One-Day Options Course
- OptionsPro
- Retirement Income Workshop
- Sure-Fire Trading Systems (VectorVest, Inc.)
- Trading as a Business Workshop
- VectorVest 7 EOD
- VectorVest 7 RealTime/IntraDay
- VectorVest AutoTester
- VectorVest Educational Services
- VectorVest OnLine
- VectorVest Options Analyzer
- VectorVest ProGraphics v6.0
- VectorVest ProTrader 7
- VectorVest RealTime Derby Tool
- VectorVest Simulator
- VectorVest Variator
- VectorVest Watchdog

