HOT TOPICS LIST
- Strategies
- Stocks
- Buy
- Investing
- Brokers
- Psychology
- Interviews
- Accumulate
- Sell
- Hold
- Spotlight
- Websites
- Candlestick Corner
- Gold & Metals
- Options Trading
LIST OF TOPICS
TRADER'S NOTEBOOK
What Are Those Indicators Really Indicating?
04/08/03 12:33:13 PM PSTby Thomas Maskell
Are the stock movements you're trying to predict random or purposeful?
| I must be doing something wrong. I've been trading for two years and I'm still not rich! I've studied the indicators. I've charted the trends. I've interpreted the candlesticks and calculated the moving averages. Surely, these tools are telling me all I need to know, but the only thing I know for sure is that my portfolio is smaller and my ego battered. Am I the problem? Am I simply not comprehending or reacting to these obvious trading signals? The answer, of course, is no. I'm not the problem. It's those pesky indicators. They tantalize and tease with their undulating charts, mathematical gyrations, and seductively simple approaches to the complexities of trading. At great cost, I have been seduced. But no longer!
INDICATION VERSUS PREDICTIONAs a stock trader, I prefer the scientific approach. This is the road to trading success. Its logical underpinnings and technical indicators provide comfort and guidance. Without the logic of science, trading is gambling, and I'm no gambler. I do not expect much from my indicators; they do not have to be perfect. They just have to tell me where my stock is going before it goes there. I would be willing to jump through some very complex mathematical hoops for just that tiny bit of premonition. For an indicator to forecast, it must demonstrate three attributes. First, it should give signals before the event to be predicted occurs. Second, it must have some cause-and-effect relationship to the event. Third and finally, it must predict the event with a reasonable degree of accuracy. Stock traders have created a labyrinth of complex technical indicators designed to do just these things. Unfortunately, they don't predict that well, because those indicators lack one or more of the attributes I've described. The most glaring of these omissions is their failure to lead. They are concurrent indicators, which makes them descriptive rather than predictive. Because these indicators are calculated from past and present prices, they do have a strong causal relationship to the price. But that relationship is only to the past and present, not the future price. So while they demonstrate the causal attribute, their inability to lead remains the fatal flaw in their predictive capabilities. Probability is used to measure the third attribute — accuracy. Probability is the science of judging outcomes in an environment of uncertainty. It expresses accuracy in percentages, with 100% being the best and 0% being essentially useless. In most business situations, 80% is an acceptable accuracy level. I recently surveyed moving average convergence/divergence (MACD) buy signals for several stocks over the past year. The results showed that MACD predicted a significant price rally less than 50% of the time. Most technical indicators are equally poor forecasting tools. They routinely fail to achieve the 80% accuracy threshold.
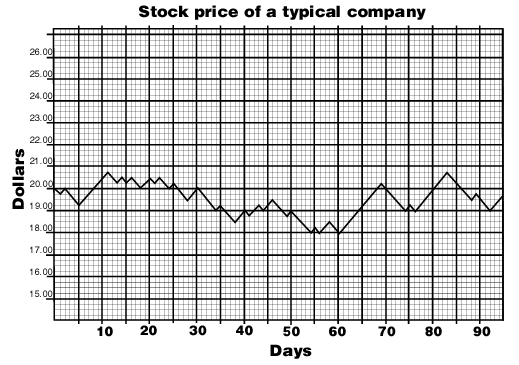
A RANDOM WALKIn Burton Malkiel's book, A Random Walk Down Wall Street, the author points out this inability of stock traders to predict price moves. He concludes that stock prices are random and, therefore, inherently unpredictable, at least in the short run. Thus, technical indicators are useless, and the search for an effective one is futile. Of course, there are a million stock traders who disagree. They search for the perfect indicator with the fervor of a Spanish explorer. The search is an act of faith. They believe the indicator exists because it must exist. There is no real evidence to support their belief — just rumors and myths and stories whispered in dark corners. All the Malkielian logic in the world will not shake their enthusiasm nor keep them from their quest. To them, each stock is a new continent to explore, and each indicator is a new map to riches. The stock presented in Figure 1 is just such a continent. It is typical of the thousands of stocks listed on the various exchanges. To the technical analyst, this chart provides a wealth of information and, based on the technical indicators, several trading opportunities.
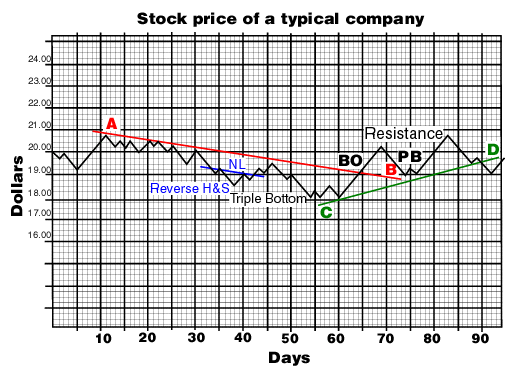
Figure 1: Stock price movement. Here you see a wealth of information that may provide several trading opportunities. Figure 2 highlights some of the information that a technician might glean from Figure 1. It includes:
An uptrend (CD) A triple bottom at $18 A breakout (BO) through the down-trendline A pullback (PB) to the up-trendline Resistance at $20.75 A reversed head & shoulders with neckline (NL) This stock chart is a technical analyst's dream come true. Or is it?
Figure 2: Various technical analysis scenarios. Here you see uptrends, downtrends, triple bottoms, breakouts, pullbacks, resistance levels, and reverse head & shoulders.
In truth, it is a fraud. Figure 2 isn't a stock chart. It was created by flipping a coin. Heads, the price went up. Tails, the price went down. Each price move, whether up or down, had a 50% chance of occurring — no matter the trend, no matter the resistance, no matter the support, no matter the previous price pattern. It is a totally random series of price moves. It is also, according to Malkiel, totally unpredictable.
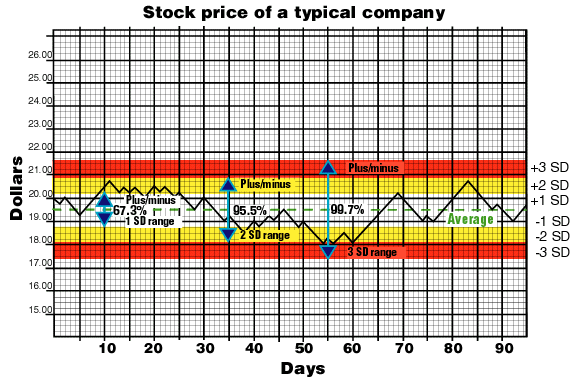
PREDICTING THE UNPREDICTABLENo amount of manipulation, whether with trendlines, moving averages, relative strength lines, or MACD, will change the odds inherent in Figure 2. Those indicators are just different ways of looking at the price line. The next move on the chart is not determined nor predicted by them. It is determined by the laws of probability, which state that in an unbiased process with only two possible outcomes, there is a 50% chance that each outcome will occur. Each flip of the coin is independent of the previous flips. The fact that there were five heads in a row does not increase the probability of heads again occurring on the next flip. The recent past does not change the odds. The trends you observe, the chart patterns you discern, and the indicators you calculate are just optical illusions that belie the mathematical reality. Of course, technicians will protest that statement. After all, stocks are not coins to be flipped. However, they do seem to act that way. In Figure 2, the price movement is controlled by the coin, which allows only a predetermined and measured price movement with each flip. Stock prices are also controlled. In the market, the price movement is controlled by a market maker, who allows only a predetermined and measured price movement with each transaction. Does this mean that Burton Malkiel is correct — that all price charts are random and our attempts to predict them are futile? A price chart is simply a numerical depiction of a process. The process consists of buyers and sellers moving to the auction post to buy and sell a stock through a market maker. Each stock buy raises the price. Each stock sale lowers the price. For any given day or series of days, the flow of buyers and sellers to the post is random, stable, and normal. Thus, over the short term, Burton Malkiel is correct: Most stock charts are random. On the other hand, our attempts to forecast a random price chart are not futile. The flipping of a coin is an example of a 5050 probability, but this does not mean that each time the coin is flipped the opposite outcome will occur (that is, heads-tails-heads-tails). It simply means that if we flip the coin enough times, we will get the same number of heads and tails. In Figure 1, the price started at $20. By the end of the chart, it was back to $20, which confirms our long-term expectation of equal outcomes. It is this long-term expectation that allows us to forecast a random stock. We can use statistics to define two important behaviors of the price distribution depicted in Figure 1. First, the numbers tend to collect around the average. Second, a fixed percentage of the numbers will be found within + or -1, 2, and 3 standard deviations from that average. In the case of a statistically normal distribution, the exact percentages are 68.3 within +1 or -1 standard deviation, 95.5 within two standard deviations, and 99.7 within three standard deviations. These behaviors are powerful clues when it comes to predicting price movements. If 68.3% of the prices will collect within one standard deviation range, 31.7% of the prices will be outside that range. Expressed in terms of probability, there is a 68.3% chance a price will fall within +1 or -1 standard deviation and a 31.7% chance it will be outside +1 or -1 standard deviation. While it is true that we cannot predict the next price move because the outcome of the next flip is 50-50, if we know that the stock is random, we can use the chart's statistical behavior to predict the next price movement. Figure 3 presents the price chart with the average and the standard deviation (SD) ranges drawn. When the price rises to $20.75, it approaches the +2 SD line. We know from our statistics that above this line we would expect to find less than 2.25% (100 97.75) of the prices. If the price continued to rise beyond this point or stayed above it, it would violate the statistical rules governing the normal distribution, which is not possible. Thus, we can make a prediction. While the next price move is still a 50-50 proposition, there is a 97.75% chance that the next price movement will be down. This is called a statistical inference.
Figure 3: Average and standard deviations. Using statistical inference, you can try to predict price movements.
In that example, we are able to infer (predict) the future direction of the price because our indicator, which is price, preceded that price movement, has a causal relationship to that movement (statistical rules), and can be accurately measured using probability (97.75%). Thus, while it is true that with random price charts individual price moves cannot be predicted, price movements can be predicted.
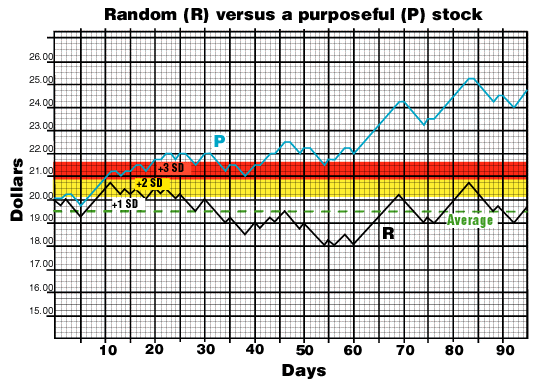
THE FLY IN THE OINTMENTIn order for this analysis to work, the stock must be random and normally distributed. Unfortunately, not all stocks are random or normal. Some stocks have purpose. Figure 4 compares a purposeful stock (P) to our random stock (R). We have made it purposeful by biasing the outcome of the coin toss to the upside. The effect of that bias is to destroy the predictive power of the plus-two SD line. Since the stock is no longer normal, the statistical rules no longer apply. Without those rules, there is no causation. Without causation, one of the necessary attributes of a predictive indicator is missing.
Figure 4: Random versus purposeful stock. The purposeful stock is meandering away on its own, breaking the normalcy so the SD lines can no longer predict the direction of the stock.
Once the P-line penetrated the two-SD line and continued on beyond the three-SD line, it was no longer offering a prediction. It was describing an event. It was telling us that this stock was no longer stable, random, and normal. The stock was now purposeful, and the old statistical rules no longer applied to it. A purposeful stock is going somewhere, and there is no indicator that can tell you where. That information resides in the collective wisdom (or lack thereof) of that herd of buyers (or sellers) that have so rudely disturbed our random little stock. Where they intend to take the stock, how fast, and for how long is beyond the realm of technical analysis. Interestingly, randomness, which Malkiel claimed precluded prediction, is the only condition that allows prediction. Once the statistical relationship between price and price movement that was built on randomness and normalcy is broken, the SD lines can no longer predict the stock's direction. Neither can any other technical indicators. But even as our stock turns purposeful and we leave the realm of technical analysis, the SD lines have offered us one last insight. They have indicated that change, alerting us that this stock is no longer random and no longer predictable.
BOLLINGER BANDSConstructing your own SD lines is easy. A good statistics book will provide the formulas, and while tedious, the math is not complex. Or you can avoid the tedium by simply transferring your stock data into a spreadsheet and letting the computer do the calculations. Most computer spreadsheets handle standard deviations easily. But if, like me, you are truly lazy or mathematically challenged, you will let someone else do the math for you. John Bollinger is that someone. He created Bollinger Bands, which are approximations of the SD lines presented in Figure 3. They are generally included in the inventory of technical indicators found on most Internet charting websites. As presented in Steven Achelis's Technical Analysis From A To Z, Bollinger made the following comments on his bands:
When prices move outside the bands, a continuation of the current trend is implied.
These are exactly the conclusions we made from our analysis of Figure 4. While Bollinger Bands are similar to SD lines, a word of caution is in order. Because they use only a few points in their calculation, Bollinger Bands are narrower and tend to expand and contract more frequently than true SD lines. The effect of this fluctuation is that they deliver more signals but less accuracy. To illustrate, observe the action of the price line around the +1 SD and the +2 SD lines in Figure 3. The price line approached the +2 SD line twice. Both times its price movement reversed and headed lower. The +2 SD line provided two reversal signals, and both accurately forecasted the next price move and movement. Now look at the price action around the +1 SD line. The price approached this line 11 times. Six times it continued rising and five times it declined. Compared to the two-SD line, the one-SD line provide 11 signals, but it was only 45% accurate. Because Bollinger Bands are calculated using fewer price observations, they act more like the one-SD line than the two- or three-SD lines. You can improve this situation by using more prices in the construction of the Bollinger Bands, or short of that flexibility, use weekly charts to determine the Bollinger Band limits and then transfer them to the daily charts. If more datapoints are used in their construction, the bands will deliver fewer but more accurate forecasting signals.
CONCLUSIONThe ability of technical analysis to predict price moves and movements has been debated for years. The debate rages, in part, because there are no universal stocks. Every stock has two faces — one random and one purposeful. And each of those faces presents different challenges to the forecaster. While this debate may never be cleared up, one thing is clear. Contrary to the random walk theory, randomness is an ally of prediction, not its enemy. When a stock is random, the rules of probability and statistics can be used to predict its short-term price movements. Purposeful stocks are another matter. Their purpose is driven by stockholders and only those stockholders know where they are taking the stock. Technical analysis can tell us where stocks have been, but we need different tools to determine where they are going. Using fundamental or economic analysis is our best chance of forecasting a purposeful stock. A stock's character and timing are the keys to forecasting the stock market. First, determine whether a stock is random and normal by observing past price actions in relation to its SD lines. If the stock is random, short-term price movements can be effectively forecasted with well-constructed Bollinger Bands. If the stock is purposeful, long-term price movements can be effectively forecasted using fundamental analysis. However, once a stock turns purposeful, its short-term price movements are unpredictable.
Thomas Maskell is an engineer and MBA. He can be reached at Brdgames33@aol.com.
SUGGESTED READINGAchelis, Steven B. [1995]. Technical Analysis From A To Z, Probus Publishing.Malkiel, Burton [2003]. A Random Walk Down Wall Street, W.W. Norton & Co., 8th edition.
Current and past articles from Working Money, The Investors' Magazine, can be found at Working-Money.com.
|
Thomas Maskell is a frequent S&C contributor whose recent book, The Complete Guide to Investing During Retirement, provides an excellent primer on investing, trading and speculation in the stock market. It is available nationwide. To comment on this article or his book, contact him at Retireestocks@aol.com or visit his blog at retireestocks.blogspot.com.
| E-mail address: | Retireestocks@aol.com |
PRINT THIS ARTICLE

Request Information From Our Sponsors
- StockCharts.com, Inc.
- Candle Patterns
- Candlestick Charting Explained
- Intermarket Technical Analysis
- John Murphy on Chart Analysis
- John Murphy's Chart Pattern Recognition
- John Murphy's Market Message
- MurphyExplainsMarketAnalysis-Intermarket Analysis
- MurphyExplainsMarketAnalysis-Visual Analysis
- StockCharts.com
- Technical Analysis of the Financial Markets
- The Visual Investor
- VectorVest, Inc.
- Executive Premier Workshop
- One-Day Options Course
- OptionsPro
- Retirement Income Workshop
- Sure-Fire Trading Systems (VectorVest, Inc.)
- Trading as a Business Workshop
- VectorVest 7 EOD
- VectorVest 7 RealTime/IntraDay
- VectorVest AutoTester
- VectorVest Educational Services
- VectorVest OnLine
- VectorVest Options Analyzer
- VectorVest ProGraphics v6.0
- VectorVest ProTrader 7
- VectorVest RealTime Derby Tool
- VectorVest Simulator
- VectorVest Variator
- VectorVest Watchdog


