HOT TOPICS LIST
- Strategies
- Stocks
- Buy
- Investing
- Brokers
- Psychology
- Interviews
- Accumulate
- Sell
- Hold
- Spotlight
- Websites
- Candlestick Corner
- Gold & Metals
- Options Trading
LIST OF TOPICS
MARKET COMMENTARY
Breaking Trendlines
04/07/03 03:42:15 PM PSTby David Penn
The prewar rally could be the calm before a perfect stock market storm.
| Would you invest in a stock that had broken down beneath a 21-year up-trendline six months ago without any real pullback or test of the trendline? How about a stock that broke down beneath a 16-year up-trendline as recently as last August? If you are listening to any of those market pundits who believe the market advance in mid-March 2003 augurs a new bull market, then your answer to these questions would have to be "yes." This is because a close look at the secular bull market in stocks that began with the 1974 bottom will reveal — with the help of a few trendlines — that a sizable countertrend move will be required if stocks are to turn their current rally into a new bull market of any magnitude. In many ways, the past three years of a fairly relentless bear market have obscured the fact that, relative to the secular bull market that began in the mid-1970s, our current bear market hath taken away far less than it seems. Consider the fact that the Standard & Poor's 500 bottomed in October 1974 at about 62. The S&P 500 peaked in March 2002 at about 1553. This means the secular bull market saw the S&P 500 gain almost 1500 points in about 28 years, a gain of more than 2300%. Most recently trading at about 875, the S&P 500 has retraced 678 of this near 1500-point move, or about 45%. At its lowest decline in the current bear market — namely, the lows of October 2002 — the S&P 500 retraced just over 50% of the secular bull market from 1974. As Dow theorists are well aware, a successful test of the 50% retracement level in a bear market is often a bullish signal. Thus, it should come as little surprise that the S&P 500 has rebounded each time it dropped below the 808 level (the 50% retracement point): in July 2002 when the S&P 500 reached a low of 776, in October 2002 when it fell as low as 769, and in March 2003 when it found intramonth support at 789 (monthly closes were 912, 886, and 874, respectively).
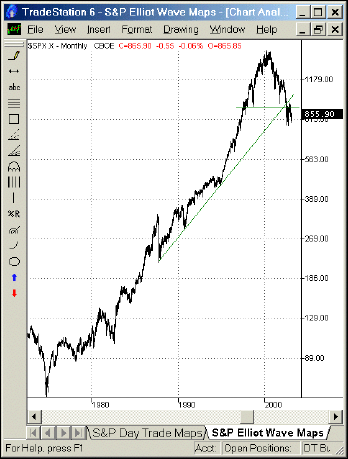
Figure 1: An up-trendline connecting the 1987 lows and the 1994 lows was broken in the summer of 2002.
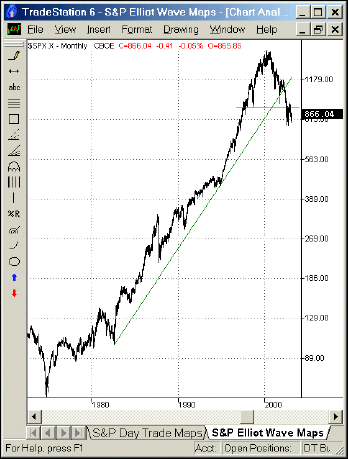
Figure 2: An up-trendline connecting the 1982 lows and the 1994 lows was broken initially in the autumn of 2001 and then again in the summer of 2002.
BREAKING DOWN?However, in contrast to the potential bullishness of what currently appears to be a successful test of the 50% retracement level, the relationship between the S&P 500 and some of the long-term trendlines of the secular bull market from 1974 to 2002 provides ample room for concern. Note in Figures 1 and 2 how both the up-trendlines from the 1987 lows and the 1982 lows have been broken by the declines of the S&P 500 in 2002. If these trendlines are valid (and it seems hard to argue against them), then the trendline breaks are no less valid and are more supportive of further declines than they are of further advances. What is most alarming about these long-term looks at the S&P 500 is that these trendline breaks suggest that the bear market in stocks is just beginning. This possibility, of course, runs counter to conventional stock market wisdom currently being peddled on Wall Street and in the mainstream financial media. Whether you believe that stocks never fall for three, er, four years in a row, or that equity valuations have finally reached "reasonable" levels, or that the Fed is providing record-breaking liquidity (by way of body-slamming the gross market rate of interest, but I digress), or that the Bush tax-cut plan will let dividend-yielding stocks lead the market to new highs, at the end of the day, all of those thoughts, notions, theories, and convictions have to face the reality of the near-terminal technical damage these trendline breaks represent. If it is difficult to think of the market as a whole being at the beginning (as opposed to midway or at the end) of a major bear market, then ask yourself: if these charts were representative of a single stock, would you purchase that stock now? Or would you be salivating at having caught a tradable that looked like a textbook example of a short opportunity? Too often, a psychological bias prevents us from seeing things as they are and, instead, seems to encourage us to see things as they should be. There is never any lack of reasons why something "should" be something it is not. But if we are not careful, this process of predetermination can create effects before causes are certain. This can lead to a snowballing of rationalization as new reasons become necessary to replace the old reasons that proved insufficient to explain why something still was not what it is supposed to be.
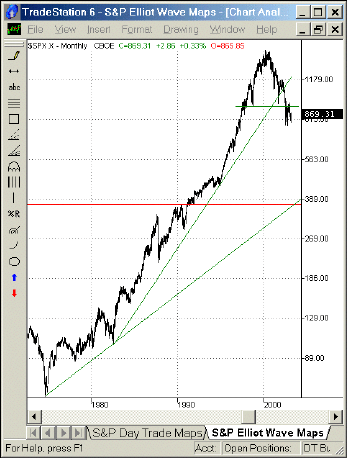
Figure 3: Watching the S&P 500 fall to the level of the 1974-82 trendline would be stunning. Breaking that trendline would be even more so.
HOW LOW COULD WE GO?Is there any relationship between these trendline breaks and the infamous (though by now almost completely forgotten) six-year head & shoulders pattern in the S&P 500? The projected downside for a successful break beneath support (a break, by the way, that occurred with the declines of July 2002) is some 630 points, which suggests a downside target of an eye-popping S&P 290. If we project out an up-trendline that connects the 1974 low with the 1982 low, then it appears that the S&P 500 would find support along this up-trendline, which is above the 290 level. If the S&P 500 were to collapse in one swoop to this up-trendline, then we would be looking at an S&P 500 of about 370. Of course, the longer it takes for the S&P 500 to move down — assuming it does continue to move down — the higher its contact point with the 19741982 uptrend line will be. But even if the S&P 500 falls to the level of the 197482 trendline, there is no guarantee that it will find enduring support there. In fact, a particularly bearish scenario would suggest that breaking this longer, 197482 secular uptrend line is the real beginning of what could certainly be called the "Mother Of All Bear Markets," setting up a test of the 1987 or even 1982 lows.
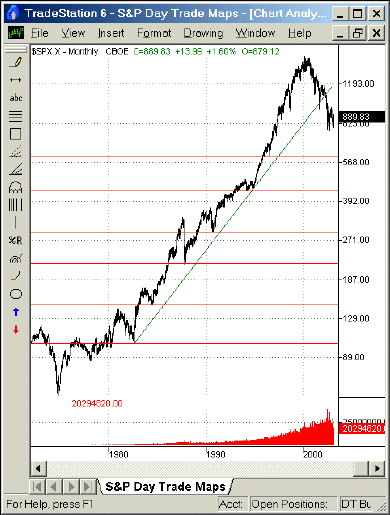
Figure 4: Between the S&P 500's current levels and the lows of 1982, there are five different support levels that may stop any slide in the S&P.
What are the mileposts of such a decline? At this point, there are six major support levels between and including the S&P 500's current levels and the 1982 recession low. The first of these levels is the 1996 correction low at about 600. Unfortunately, the support at this level is — like the correction of 1996 was — not particularly strong. Thus, if the S&P 500 falls from current levels, there is a real possibility that the support at 1996, if tested, might not hold. More significant support exists at the 1994 bear market lows of about 430. However, support at this level is only somewhat stronger than that at the 1996 lows. The recession low of 1990-91 at 290 offers more in the way of support and the Black Monday crash of 1987 lows of 217 offer stronger support still. Finally, the bear market lows of 198384 provide a last opportunity for support before reaching the 1982 lows at about 100.
David Penn may be reached at DPenn@Traders.com. Charts courtesy of TradeStation
Current and past articles from Working Money, The Investors' Magazine, can be found at Working-Money.com.
|
Technical Writer for Technical Analysis of STOCKS & COMMODITIES magazine, Working-Money.com, and Traders.com Advantage.
| Title: | Traders.com Technical Writer |
| Company: | Technical Analysis, Inc. |
| Address: | 4757 California Avenue SW |
| Seattle, WA 98116 | |
| Phone # for sales: | 206 938 0570 |
| Fax: | 206 938 1307 |
| Website: | www.traders.com |
| E-mail address: | DPenn@traders.com |
Traders' Resource Links | |
| Charting the Stock Market: The Wyckoff Method -- Books | |
| Working-Money.com -- Online Trading Services | |
| Traders.com Advantage -- Online Trading Services | |
| Technical Analysis of Stocks & Commodities -- Publications and Newsletters | |
| Working Money, at Working-Money.com -- Publications and Newsletters | |
| Traders.com Advantage -- Publications and Newsletters | |
| Professional Traders Starter Kit -- Software | |
PRINT THIS ARTICLE

Request Information From Our Sponsors
- StockCharts.com, Inc.
- Candle Patterns
- Candlestick Charting Explained
- Intermarket Technical Analysis
- John Murphy on Chart Analysis
- John Murphy's Chart Pattern Recognition
- John Murphy's Market Message
- MurphyExplainsMarketAnalysis-Intermarket Analysis
- MurphyExplainsMarketAnalysis-Visual Analysis
- StockCharts.com
- Technical Analysis of the Financial Markets
- The Visual Investor
- VectorVest, Inc.
- Executive Premier Workshop
- One-Day Options Course
- OptionsPro
- Retirement Income Workshop
- Sure-Fire Trading Systems (VectorVest, Inc.)
- Trading as a Business Workshop
- VectorVest 7 EOD
- VectorVest 7 RealTime/IntraDay
- VectorVest AutoTester
- VectorVest Educational Services
- VectorVest OnLine
- VectorVest Options Analyzer
- VectorVest ProGraphics v6.0
- VectorVest ProTrader 7
- VectorVest RealTime Derby Tool
- VectorVest Simulator
- VectorVest Variator
- VectorVest Watchdog


