

HOT TOPICS LIST
- Strategies
- Stocks
- Buy
- Investing
- Brokers
- Psychology
- Interviews
- Accumulate
- Sell
- Hold
- Spotlight
- Websites
- Candlestick Corner
- Gold & Metals
- Options Trading
LIST OF TOPICS
THE CHARTIST
Forecasting With Elliott Wave Theory
05/13/03 03:28:53 PM PSTby Eric Morgan
Here's a simple mathematical technique you can use as a forecasting tool.
| Several months ago, Barron's featured an article on Robert Prechter, the guru of the Elliott wave theory. The article stated that Prechter made his name based on one good market call: he predicted the great bull market of the 1980s. The article went on to say that Elliott wave theory is widely regarded at best as "a meaningless projection of spurious patterns on random events, and at worst as voodoo." I had no idea that Elliott wave theory is so little respected in the financial establishment, and I would like to help elevate it to the level it deserves. The best way to do this is to make a market forecast based on the theory and watch it come true. It's best when a forecast is based on solid objective analysis, not sheer guesswork, which is the origin of almost all the forecasts coming out of Wall Street. Far from being meaningless — "projections of spurious patterns on random events" — Elliott wave theory is a reliable analytical tool. It can give structure, form, and perspective to the market technician's analysis.
THE THEORYElliott wave theory states that the market moves in five waves in the direction of the trend of one larger degree, and three waves against the trend of one larger degree. Figure 1 shows a completed five-wave structure of supercycle degree of the Dow Jones Industrial Average (DJIA), beginning at the 1932 bottom and ending at the January 2000 top. The five waves of cycle degree are superimposed on the chart.
|
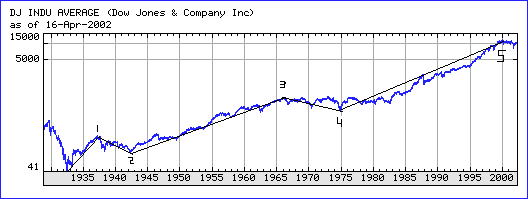 Figure 1: Completed five-wave structure of supercycle (19322000). Note how wave 2 corrects the wave 1 advance, and wave 4 corrects the wave 3 advance. After the fifth wave, a correction of the entire five-wave sequence is expected to take place.
In a five-wave sequence, waves 1, 3, and 5 advance in the direction of the trend of one larger degree, which in this case is of supercycle degree. That trend was obviously up. Wave 2 corrects the advance of wave 1, and wave 4 corrects the advance of wave 3. After wave 5, a correction occurs against the entire five-wave sequence. These waves of cycle degree subdivide into primary waves. Figure 2 shows how cycles I, III, and V subdivide into a five-wave structure of primary degree. If each wave is idealized as a straight line, then Figure 3 shows the idealized supercycle subdivided into its cycle and primary wave structures. Each wave is labeled with the theoretical value of the DJIA at the beginning and the end of the wave. The theoretical values of the DJIA are used because the actual print high and low of the DJIA weren't recorded until the 1970s. The theoretical high is the value of the DJIA if all 30 stocks hit their highs at the same time during the day. The theoretical low is the value of the DJIA if all 30 stocks hit their lows of the day at the same time.
|
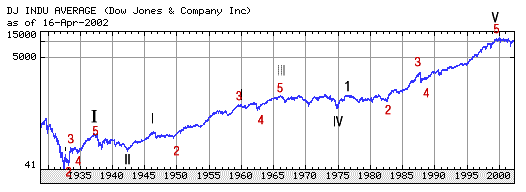 Figure 2: Cycles I, III, and V subdivide into a five-wave structure. |
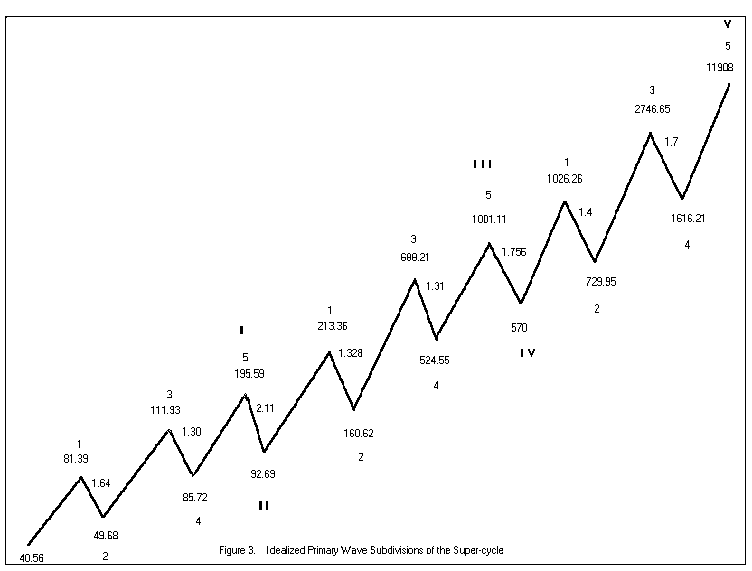 Figure 3: The idealized supercycle subdivided into cycle and primary wave structure.
YES, IT WORKSHere are three forecasts for the DJIA based on three different techniques that determine the size of the correction against the advance of cycle V, which began in 1974 at 570. The primary wave 3 top of both cycles I and III unexpectedly provided a way to calculate the two most important lows of the entire supercycle structure (except for the beginning of the supercycle). The cycles II and IV lows are mathematically related to the primary wave 3 tops by a simple constant. A similar relationship appeared in the wave 4 lows. Based on these observations, I took the primary wave 3 top of cycle I at 111.93, and divided it by the cycle II low at 92.69. The result is 1.207 (111.93/92.69). Next, I took the primary wave 3 top of cycle III at 688.21 and divided it by the cycle IV low at 570. The result is once again 1.207 (688.21/570). These results are identical to three decimal places! So from the wave 3 top in both cycles I and III, the cycle II and cycle IV lows could be calculated by dividing by a simple constant, 1.207. If you apply the same calculation to the primary wave 3 top in cycle V, you get 2746.65/1.207 = 2275. This value is the forecast for the DJIA's decline, based on the cycle V advance from the 1974 bottom. What worked for cycles I and III may work for cycle V. A second forecasting technique: take the cycle II low at 92.69 and divide that by the primary wave 4 low of cycle I. The result is 1.08 (92.69/85.72). If the cycle IV low at 570 is divided by the primary wave 4 low of cycle III, then the result is also 1.08 (570/524.55). Therefore, if we apply this 1.08 factor to the primary wave 4 low of cycle V, the result is 1616.21 * 1.08 = 1745. The cycle II and cycle IV lows were 8% above the wave 4 lows of cycle I and cycle III. Perhaps this will also occur for cycle V. A third forecast can be produced through a simple technique. Figure 3 shows the correction factors of the declining waves in the supercycle structure. The correction factor is simply the value of the DJIA at the top of the wave divided by the value of the DJIA at the bottom of the wave. For instance, wave 2 of cycle I started at 81.39 and ended at 49.68. Therefore, the correction factor is 81.39/49.68 = 1.64. If the correction factors of waves 2 and 4 are multiplied, the result is 2.13 (1.64 * 1.30). The following decline, cycle II's correction factor, is 2.11 (195.59/92.69), which is very close to 2.13. Let's analyze cycle III the same way. Multiplying the waves 2 and 4 correction factors together, the result is 1.328 * 1.31 = 1.743. The correction factor of the following decline, cycle IV, is 1.756. Again, this is very close to 1.743. Now, let's calculate cycle V's result. Multiplying wave 2 and wave 4's correction factors, we get 1.40 * 1.70 = 2.38. Applying this to the 11908 cycle V top, we get 11908/2.38 = 5003.
IN SUMMARYThree different objective techniques give three different answers for the correction of the cycle V advance from the 1974 bottom. All three techniques result in identical answers for the corrections against cycles I and III. That these three techniques calculated the same answers for two major bottoms should ruffle the feathers of random market theorists. It is as well it should, because what it implies is that the market is not random. The analysis I have done proves that the whole supercycle structure is a design, or a mathematical expression. There is nothing random about the market. Market tops are related to each other, just as market declines are related to each other. Here's an example of market bottoms relating to each other. If the cycle II low at 92.69 is divided by the start of the supercycle, the result is 2.28 (92.69 / 40.56). If the cycle IV low is divided by the start of the supercycle, the result is 14.05 (570 / 40.56). 14.05= 3.28 * 4.28. An obvious sequence of numbers is being formed. The next numbers in the sequence are 5.28 and 6.28. The product of these numbers is 33.16. If this number is multiplied by the start of the supercycle, the result is 1345 (33.16 * 40.56). Therefore, this is another possible candidate for a major low for the DJIA. It will be interesting to see where the final bear market bottom occurs. At least, we can infer terrific declines from these levels. Most financial observers can't conceive of the market falling to 2275, or worse, 1745. The news gets even worse, because these numbers only represent where the DJIA could fall, based on the advance from the 1974 bottom. Since this is a decline of supercycle degree and not just of cycle degree, this portends an even worse fall for the DJIA. This correction will correct the advance from the 1932 bottom, not just the 1974 bottom. These forecasted levels may represent a point at which the market might reverse and turn higher, representing a significant, but not the final, bottom. Since these techniques worked perfectly for the corrections against cycles I and III, they shouldn't be discounted for the correction against cycle V. At the very least, this inserts some science into the art of forecasting. The supercycle that extended over a 68-year timeframe and completed in January 2000 is the first that can be studied precisely, because we have the theoretical values of the daily highs and lows going back to the beginning of the timeframe. The Elliott wave theory is ready to make its mark on the investment landscape in the years ahead if the market declines precipitously as it forecasts. Whether these forecasted levels are hit may be immaterial if the mathematics of the new supercycle just started is independent of the one just completed. In the meantime, there is much to be learned from the supercycle just passed. There's one thing I do know: Those waves aren't random, they are part of a design. It's up to us to understand it.
Eric Morgan is an electronics engineer and can be reached at morganed@nswc.navy.mil.
Current and past articles from Working Money, The Investors' Magazine, can be found at Working-Money.com.
|
| E-mail address: | morganed@nswc.navy.mil |
PRINT THIS ARTICLE

Request Information From Our Sponsors
- VectorVest, Inc.
- Executive Premier Workshop
- One-Day Options Course
- OptionsPro
- Retirement Income Workshop
- Sure-Fire Trading Systems (VectorVest, Inc.)
- Trading as a Business Workshop
- VectorVest 7 EOD
- VectorVest 7 RealTime/IntraDay
- VectorVest AutoTester
- VectorVest Educational Services
- VectorVest OnLine
- VectorVest Options Analyzer
- VectorVest ProGraphics v6.0
- VectorVest ProTrader 7
- VectorVest RealTime Derby Tool
- VectorVest Simulator
- VectorVest Variator
- VectorVest Watchdog
- StockCharts.com, Inc.
- Candle Patterns
- Candlestick Charting Explained
- Intermarket Technical Analysis
- John Murphy on Chart Analysis
- John Murphy's Chart Pattern Recognition
- John Murphy's Market Message
- MurphyExplainsMarketAnalysis-Intermarket Analysis
- MurphyExplainsMarketAnalysis-Visual Analysis
- StockCharts.com
- Technical Analysis of the Financial Markets
- The Visual Investor