HOT TOPICS LIST
- Strategies
- Stocks
- Buy
- Investing
- Brokers
- Psychology
- Interviews
- Accumulate
- Sell
- Hold
- Spotlight
- Websites
- Candlestick Corner
- Gold & Metals
- Options Trading
LIST OF TOPICS
FOCUS ON
Bear Market Rallies
05/20/03 03:45:01 PM PSTby David Penn
A look at upward second Elliott waves and the springtime terror of the bears.
| Most stock market bears saw the rally of March 13 as a relatively welcome development -- if only for the opportunity to sell the market at a lofty price most of them were convinced would not hold. But as the market rose and continued to rise, bear after once-unrepentant bear was sent howling (and short-covering) back into the depths of the forest as land was clear-cut for the grazing of the bulls. After all, while trading with the trend is still considered to be technical analysis gospel, the lure of calling -- and profiting from -- reversals will always loom large in the minds of aggressive traders. Fortunately, there are a number of analytic tools available to keep the aggressive bear's "fear factor" somewhat in check. Among the more powerful of these tools is the Elliott wave methodology. In the context of the Standard & Poor's 500's March-April 2003 market rally, Elliott wave analysis allowed for a countertrend, second wave that could go as high as a previous wave 4 peak of one higher degree. That wave 4 peak was about 954, reached at the December 2nd conclusion of the October 2002 rally. An even more limiting resistance level could be found at the previous second-wave peak of one degree lower — the January 13th peak of 935, which also served as the right shoulder of the head & shoulders top that preceded the S&P 500's decline over the balance of January, all of February, and into March. For many bears, it might have been difficult to keep the "doom and gloom" faith during the 2003 spring rally — a rally that was accompanied by levels of bullishness not seen since, well, the 2002 spring rally, along with exhortations from market pundits that "things were getting better" and that "recovery" was (still) right around the corner. As such, it might be helpful to recall some of the characteristic phenomena of second waves. Properly understood in the context of the current bear market, these phenomena allow investors and speculators to not only enjoy any gains they may have earned by successfully buying the beginning of the second wave (and there were no lack of market observers encouraging investors to buy in the early days of this rally), but also to help market participants maintain the proper patience, allowing the second wave to run its full course before moving in, as bears do, for the inevitable mauling.
ON SECOND WAVESUnfortunately, much of what Elliott wave theory suggests about the markets is written from the perspective of a large-degree bull market. This is understandable inasmuch as the long-term trend of stock market prices since the late 18th century has been upward. But this general orientation does bring some, if not difficulty, then at least confusion when dealing with large-degree bear markets, such as the allegedly Supercycle bear market that began in the wake of the 2000 market top. How are the perceptive remarks about the vitality of third waves, or the rules for the double retracement of extensions, or for marking complex corrective triangles, to be interpreted when the secular trend of the market is down instead of up? Choosing just one contemporary example may help shed some light on the challenges faced by Elliott wave students and theorists when attempting to "handicap" the price action of the current stock market — the S&P 500, in particular. Consider the remarks made by A.J. Frost and Robert Prechter in their classic Elliott Wave Principle, as they relate to second waves:
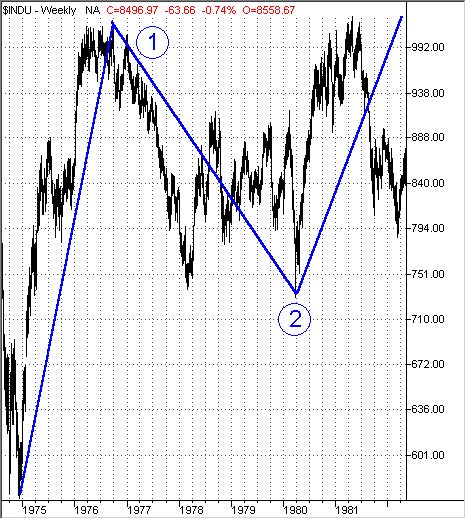
Second waves often retrace so much of wave one that most of the profits gained up to that time are eroded away by the time it ends. This is especially true of call options purchases, as premiums sink drastically in the stepped-up selling during second waves. Investors have finally gotten "one more rally to sell on," and they take advantage of it. Second waves often produce downside nonconfirmations and Dow theory "buy spots," when low volume and volatility indicate a dry-up of selling pressure. This is a textbook description of a second wave in an upward or impulse five-wave sequence. As such, it reflects what many investors and speculators (intermediate-term traders) have experienced in such memorable second waves in the Dow Jones industrials as the Primary 2nd from September 1976 to March 1980 (Figure 1) and the larger Cycle II from March 1937 to April 1942. Interestingly, in each case, market sentiment at the end of these second waves was as bad or worse than sentiment was at the beginning of the wave ones that preceded them — even if the wave 2 bottom was higher than the wave 1 bottom, as was the case in both instances.
Figure 1: The declining Primary 2nd wave from 1976 to 1980 in the Dow Jones Industrial Average (DJIA) convinced many investors that the long-lasting bear market was still alive and well.
An analysis of upward second waves — as they can occur in the intermediate and primary degrees of bear markets (that is, bullish intermediate and minor 2nd waves) — could be put together using much of the same language that Frost and Prechter used to describe downward second waves in large-degree bull markets. Consider the following "reworking" of Frost and Prechter's remarks, for example, as it applies to the upward intermediate 2nd from April to October 2000:
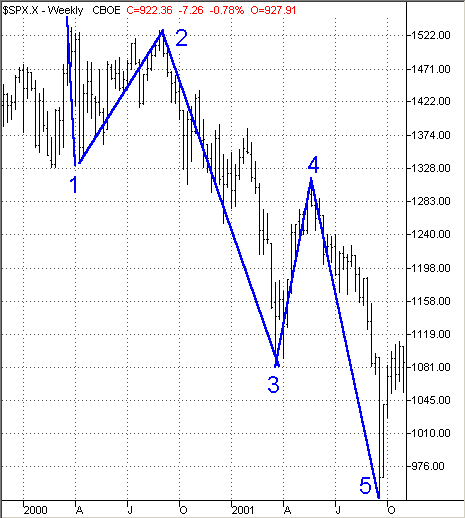
Second waves often recover so much of wave one that most losses gained up to that time are recouped by the time it ends. . . . Investors have finally gotten "one more dip to buy" and they take advantage of it. Second waves often produce upside nonconfirmations and Dow theory "sell spots" . . . . Recall that the S&P 500 peaked on March 24, 2000, at 1552.87 (Figure 2) and subsequently made a wave 1 low on April 14 at 1339.40 — a 13.7% decline. The S&P 500 rallied in a wave 2 advance for the next few months, eventually reaching a high of 1530.09 on September 1 — a wave 2 high that was less than 23 points away from the all-time high in the S&P 500. This reflects the point above that a second wave tends to retrace most if not all of the first wave, whether or not these waves are in large-degree bull or bear markets.
Figure 2: The second wave from April to October 2000 convinced many investors that the bull market was very much still intact.
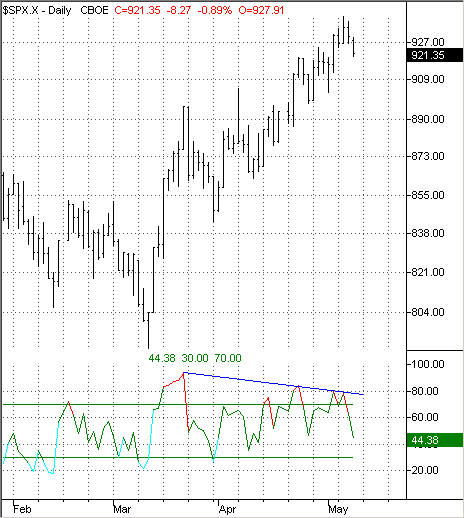
NONCONFIRMATIONS AND SELL SPOTSKey to this discussion of second waves is the fact that there are abundant, nonElliott wave ways to determine the strength of the second wave as it progresses. For example, by noting that upside nonconfirmations are part of the phenomena of advancing second waves, technical analysts who are not persuaded by Elliott wave methodologies can use a variety of technical indicators, from on-balance volume to stochastics to the relative strength index, to determine whether an upside nonconfirmation has indeed occurred. For example, consider the price action of the spring 2003 rally from late March to early May in comparison to the performance of the relative strength index, first developed by pioneering technical analyst J. Welles Wilder.
Figure 3: A falling realtive strength index (RSI) during the spring advance in the S&P 500 has emboldened skeptics of the rally since late April.
Writing in his essential technical analysis textbook about the relative strength index (RSI), Technical Analysis From A To Z, Steven B. Achelis notes:
A popular method of analyzing the RSI is to look for a divergence in which the security is making a new high, but the RSI is failing to surpass its previous high. This divergence is an indication of an impending reversal. Looking at Figure 3, we see that the RSI followed the S&P 500 down in the last week of March. However, as price action rebounded in April to make a higher high, the RSI failed to do so. Although the RSI did make a higher high in late April vis-à-vis the mid-month high (as did the S&P 500), it failed to make a higher high vis-à-vis the high registered at the end of March. In sum, as the S&P 500 was trending upward, the RSI was trending down. As Achelis suggests, this divergence was a "nonconfirmation" that suggested the possibility of a reversal in the price action of the S&P 500. Achelis goes further. He points out that "when the RSI then turns down and falls below its most recent trough, it is said to have completed a 'failure swing.' The failure swing is considered a confirmation of the impending reversal." At this point, the RSI of the S&P 500 has not yet moved beneath its most recent trough — that trough being the RSI low point at about 45.34. But it is close enough to merit a good deal of attention for those who have been long the S&P 500 during the rally, as well as those who are considering short opportunities when the rally appears to have ended.
David Penn may be reached at DPenn@Traders.com.
SUGGESTED READINGAchelis, Steven B. [1995]. Technical Analysis From A To Z, Probus Publishing.Frost, A.J., and Robert Prechter Jr. [1978]. Elliott Wave Principle, New Classics Library. Charts courtesy of TradeStation
Current and past articles from Working Money, The Investors' Magazine, can be found at Working-Money.com. |
Technical Writer for Technical Analysis of STOCKS & COMMODITIES magazine, Working-Money.com, and Traders.com Advantage.
| Title: | Traders.com Technical Writer |
| Company: | Technical Analysis, Inc. |
| Address: | 4757 California Avenue SW |
| Seattle, WA 98116 | |
| Phone # for sales: | 206 938 0570 |
| Fax: | 206 938 1307 |
| Website: | www.traders.com |
| E-mail address: | DPenn@traders.com |
Traders' Resource Links | |
| Charting the Stock Market: The Wyckoff Method -- Books | |
| Working-Money.com -- Online Trading Services | |
| Traders.com Advantage -- Online Trading Services | |
| Technical Analysis of Stocks & Commodities -- Publications and Newsletters | |
| Working Money, at Working-Money.com -- Publications and Newsletters | |
| Traders.com Advantage -- Publications and Newsletters | |
| Professional Traders Starter Kit -- Software | |
PRINT THIS ARTICLE

Request Information From Our Sponsors
- StockCharts.com, Inc.
- Candle Patterns
- Candlestick Charting Explained
- Intermarket Technical Analysis
- John Murphy on Chart Analysis
- John Murphy's Chart Pattern Recognition
- John Murphy's Market Message
- MurphyExplainsMarketAnalysis-Intermarket Analysis
- MurphyExplainsMarketAnalysis-Visual Analysis
- StockCharts.com
- Technical Analysis of the Financial Markets
- The Visual Investor
- VectorVest, Inc.
- Executive Premier Workshop
- One-Day Options Course
- OptionsPro
- Retirement Income Workshop
- Sure-Fire Trading Systems (VectorVest, Inc.)
- Trading as a Business Workshop
- VectorVest 7 EOD
- VectorVest 7 RealTime/IntraDay
- VectorVest AutoTester
- VectorVest Educational Services
- VectorVest OnLine
- VectorVest Options Analyzer
- VectorVest ProGraphics v6.0
- VectorVest ProTrader 7
- VectorVest RealTime Derby Tool
- VectorVest Simulator
- VectorVest Variator
- VectorVest Watchdog


