HOT TOPICS LIST
- Strategies
- Stocks
- Buy
- Investing
- Brokers
- Psychology
- Interviews
- Accumulate
- Sell
- Hold
- Spotlight
- Websites
- Candlestick Corner
- Gold & Metals
- Options Trading
LIST OF TOPICS
FOCUS ON
Building A Better Breakout
07/01/03 03:15:19 PM PSTby David Penn
How Donchian channels can help separate great, don't-look-back breakouts from merely good ones.
| It is the goal of almost every trader to buy on a breakout. Regardless of whether a trader's individual style tilts toward momentum plays in which higher prices beget higher prices and lower prices beget lower prices, or whether he tends toward value plays in which the fairly valued become bargains and only the bargains get bought, every trader looks for some catalyst, some spark that sends a jolt of volatility into the market, propelling the trader's position in the desired direction. But for every true breakout that does just this, there are at least three or four breakouts that feint in the trader's desired direction before reversing abruptly and heading back into the previous consolidation — or worse, completely reversing and, with eye-popping speed, heading in the opposite direction, sending the trader scrambling to sell or cover the position. Is there any way to tell the real breakouts from the false ones before they cause too much damage to loss-averse traders? Even "real" breakouts that do propel prices to higher ground can suffer sizable retracements and pullbacks that, in some cases, are deep enough to cause traders to be whipsawed out of otherwise solid positions. Can these situations be avoided?
AS RESISTANCE BECOMES SUPPORTWhat is the definition of a technical breakout? One simple definition suggests that, in the case of an uptrend, when prices leave a consolidation range and mark a higher high, then a breakout has occurred. Other definitions involve the presence of high volume at the same time that prices leave the consolidation range as an additional signal that the breakout is valid and likely to be lasting. I think that both of these are worthwhile ingredients in a breakout, though I would suggest that anytime prices make a high, then pull back, and then notch a higher high, a breakout of some sort has occurred — whether or not there was a textbook "consolidation range" preceding the market move. Such a range has the advantage of pointing to the sort of decline in volatility that often precedes a sizable move in the market. But a breakout can take place whether or not there is a sizable consolidation range. How then does someone trading on such a technical breakout avoid being stopped or whipped out when the breakout pulls back? One method I've been looking into uses 20-day price channels (Donchian price channels) to determine support levels that a market, if it is truly prepared to move in the desired direction, will not penetrate. But rather than determine this support level based on the lower end of the 20-day price channel (composed of 20-day highs and 20-day lows), I have begun seeing the upper end of the 20-day price channel (the 20-day highs) as potentially a more effective support level than the 20-day lows, or than a moving average dividing the channel into upper and lower sections, or any other such method of parsing the channel. If prices break out to a new 20-day high, for example, then the old 20-day high that was previously resistance should subsequently serve as support. If prices do not remain above this resistance-turned-support level immediately after the break, then while it is true that prices may continue to move higher, or may move higher eventually, it is also true that the market might not yet be ready to make what are often its quickest, most intense gains. Why this approach? This use of the 20-day price channel is compelling because it helps a trader identify markets that are most ready to move in the desired direction. If a recent 20-day high is tested shortly after it is broken, then that 20-day high — virtually by definition — is now support. This support often proves to be surprisingly long-lasting. Even after the market has moved higher and subsequently experiences its share of corrections, those 20-day highs that switched from serving as resistance to serving as support often hold until the market truly begins to break down. Of course, by that time, most traders are long gone — with profits in hand.
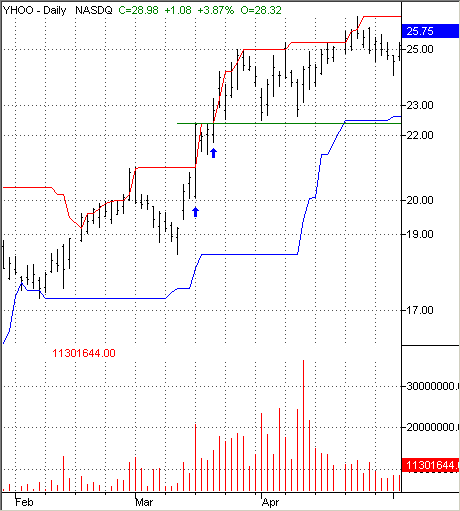
TRADING BETTER BREAKOUTSUsing the 20-day price channel of highs and lows provides a consistent way of determining which resistance-becomes-support instances are likely to be most reliable and indicative of continued moves. While any price high or low could — and often does — serve as a point of resistance that may turn into support, a high or low that has persisted for some period of time is all the more likely to represent significant resistance before a breakout. This means it is equally likely to represent significant support after a breakout and test. Twenty days is a reasonable number, and is the same term used by many trend followers who rely on Donchian or price channel breakouts. Consider the following examples of stocks in uptrends. Yahoo! (YHOO) began moving up in February 2003, as seen by the higher 20-day lows from late January into February (Figure 1). A breakout alert arrives on March 17, with a strong new 20-day high and high volume. A long entry point pursuant to this breakout would be above the high of the breakout day at approximately 22.45 three days later. Incidentally, this entry occurred on a day that marked a new 20-day high — and another potential support point once prices advanced. Note how once prices broke out above the 20-day high in both cases, they did not trade below these levels. In fact, this position would be a winner up to and including the point at which it finally dropped below a three-month uptrend line at 27.95 for a gain of 5.50.
Figure 1. Once Yahoo! broke out at 22.50, it remained above that old, 20-day high.
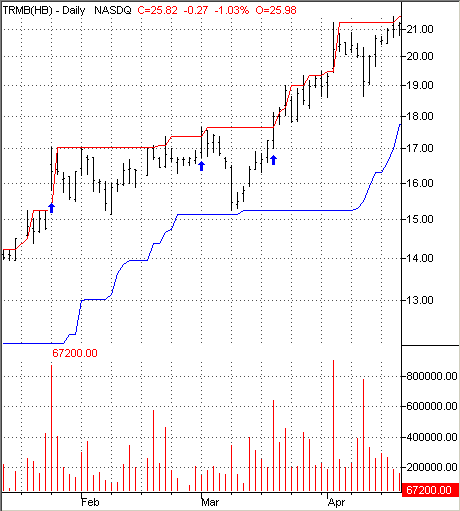
Two subsequent 20-day high breakouts in Yahoo! — for those who did not catch the stock at lower levels — were not nearly as successful. In mid-April, a 20-day high breakout occurred on relatively light volume, and prices reached the high of this breakout day two days later. Unfortunately, prices for Yahoo! closed beneath the most recent 20-day high two days later for what would have been a 75-cent per share loss (assuming an entry around 25.70 and an exit around 24.95). Another 20-day high breakout failure occurred in May as prices broke out to a new 20-day high on significant volume, and provided an entry above the breakout day three days later. While this "entry day" itself registered a 20-day high, the following day saw prices reverse sharply and fall beneath the previous 20-day high. Here, a loss in the neighborhood of 1.75 per share would have been the likely downside (assuming an entry around 27.70 and an exit around 26). For a second example, consider a relatively little-known stock, Trimble Navigation Limited (TRMB), which has been in an uptrend since October 2002. A new 20-day high on strong volume was registered in late January 2003 as TRMB moved above 16. There was no follow-through to the upside as prices retreated. But the support they found on the previous 20-day high (at about 15.30) was a bullish development. Another new 20-day high arrived in March; however, the volume was light and follow-through to the upside was once again nonexistent. As prices retreated, they again found support on the previous 20-day high around 15.30. This further supported the bullish case that solid support on the back of a previous 20-day high (resistance turned support) had developed. The question then was: When would TRMB respond with a confident break to the upside without suffering a major retracement? The answer came seven days later as TRMB broke out to a new 20-day high at 18 (Figure 2). With follow-through to the upside one day later, traders had an entry opportunity to the long side. If TRMB was truly ready to take off, then the 20-day high just broken would turn into a support level beneath which TRMB should not trade. As the chart shows, this is exactly what happened, as TRMB moved from a breakout level of around 18.25 in March to a recent close of 26 in June, a gain of almost eight points or nearly 44%.
Figure 2. Trimble Navigation tried to break out twice in January and February before getting it right with a "don't-look-back" breakout in March.
NOT PERFECT, BUT BETTERSome may ask, would it not have been better to buy Trimble Navigation the second time it bounced off the old 20-day high in March? Wouldn't it have been better to go ahead and buy Yahoo! on the new 20-day high in April, and hold it through the relatively slight correction? After all, Yahoo! gained more than four points when it rebounded. These are all worthwhile questions, and worthwhile alternative approaches that may suit the psychology and trading style of various investors and traders. The idea here is to spot and stay with those stocks that look most ready to move higher, sooner. Breakouts that follow through on the upside on the following day should not fall back beneath near-term support if the stock is truly ready to move higher in a short period of time. However, while there are numerous worthwhile ways to determine just where that near-term support lies, the old technical analysis standby that resistance often turns into support provides a consistent approach to determining how low a stock may retreat after a strong breakout before continuing onward. It also provides a nearby exit point should the breakout prove unduly risky or downright false.
David Penn may be reached at DPenn@Traders.com. Charts courtesy of TradeStation
Current and past articles from Working Money, The Investors' Magazine, can be found at Working-Money.com.
|
Technical Writer for Technical Analysis of STOCKS & COMMODITIES magazine, Working-Money.com, and Traders.com Advantage.
| Title: | Traders.com Technical Writer |
| Company: | Technical Analysis, Inc. |
| Address: | 4757 California Avenue SW |
| Seattle, WA 98116 | |
| Phone # for sales: | 206 938 0570 |
| Fax: | 206 938 1307 |
| Website: | www.traders.com |
| E-mail address: | DPenn@traders.com |
Traders' Resource Links | |
| Charting the Stock Market: The Wyckoff Method -- Books | |
| Working-Money.com -- Online Trading Services | |
| Traders.com Advantage -- Online Trading Services | |
| Technical Analysis of Stocks & Commodities -- Publications and Newsletters | |
| Working Money, at Working-Money.com -- Publications and Newsletters | |
| Traders.com Advantage -- Publications and Newsletters | |
| Professional Traders Starter Kit -- Software | |
PRINT THIS ARTICLE

Request Information From Our Sponsors
- StockCharts.com, Inc.
- Candle Patterns
- Candlestick Charting Explained
- Intermarket Technical Analysis
- John Murphy on Chart Analysis
- John Murphy's Chart Pattern Recognition
- John Murphy's Market Message
- MurphyExplainsMarketAnalysis-Intermarket Analysis
- MurphyExplainsMarketAnalysis-Visual Analysis
- StockCharts.com
- Technical Analysis of the Financial Markets
- The Visual Investor
- VectorVest, Inc.
- Executive Premier Workshop
- One-Day Options Course
- OptionsPro
- Retirement Income Workshop
- Sure-Fire Trading Systems (VectorVest, Inc.)
- Trading as a Business Workshop
- VectorVest 7 EOD
- VectorVest 7 RealTime/IntraDay
- VectorVest AutoTester
- VectorVest Educational Services
- VectorVest OnLine
- VectorVest Options Analyzer
- VectorVest ProGraphics v6.0
- VectorVest ProTrader 7
- VectorVest RealTime Derby Tool
- VectorVest Simulator
- VectorVest Variator
- VectorVest Watchdog


