
HOT TOPICS LIST
- Strategies
- Stocks
- Buy
- Investing
- Brokers
- Psychology
- Interviews
- Accumulate
- Sell
- Hold
- Spotlight
- Websites
- Candlestick Corner
- Gold & Metals
- Options Trading
LIST OF TOPICS
PRINT THIS ARTICLE
by Martin J. Pring
How is volume used in technical analysis and what can it tell us?
Martin J. Pring
Martin J. Pring founded the International Institute for Economic Research in 1981. He is the author of several books, including the classic Technical Analysis Explained, and Introduction To Technical Analysis, the first technical analysis multimedia CD-ROM. He pioneered the introduction of videos as an educational tool for technical analysis in 1987, and was the first to introduce educational interactive CDs in this field.
PRINT THIS ARTICLE
INVESTING
Get A Hold On Investing Volume Basics
10/25/00 04:12:22 PM PSTby Martin J. Pring
How is volume used in technical analysis and what can it tell us?
| Most of the indicators used in technical analysis are based on pricing data. We either use the prices themselves, a statistical manipulation of the prices with moving averages, or oscillators of some kind. Volume, though, is an independent variable and can therefore be extremely useful in confirming price action. There are many ways of using volume, such as the construction of oscillators, on-balance volume lines, and the designing of indicators using both volume and price. I will discuss some of these more sophisticated variations of volume analysis in future articles. In this one, however, I will concentrate on the basics. |
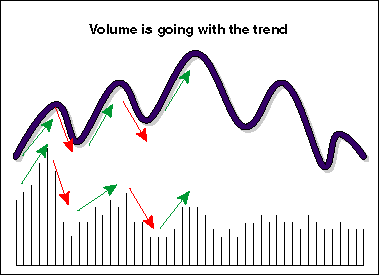 FIGURE 1: VOLUME PLAYS. In a normal market, volume normally rises with price increases and falls with price decreases.  FIGURE 2: VOLUME TREND. Look at the overall movement of volume to discern confirmation, not the occasional days that don't confirm. PERFECT BALANCE First, it is important to understand there is always a perfect balance between buyers and sellers because the amount of a security sold is always identical to that which is purchased. What moves prices is the relative enthusiasm of buyers and/or sellers. If sellers are more motivated than buyers, then the price will decline. If buyers are more motivated than sellers, then the price will rise. Volume is usually displayed in charts as a series of histograms underneath the price. This is a useful form of presentation, since it reflects expansions and contractions in activity. There are several key principles used in interpreting volume, but before I analyze them, it is important to understand that when I talk about changes in the level of volume, I am referring to volume changes relative to the recent past. For example, it's impossible to compare the volume on the New York Stock Exchange (NYSE) today when it's in the hundreds of millions with the volume at the start of the 20th century when it was less than one million. This is because there are far more shares listed now. Activity has also grown because of futures and options arbitrage, and reduced commission charges allow more frequent trading as well. But you can compare high volume this week with volume two weeks ago. Here's a brief overview of some of the basic principles of volume interpretation: VOLUME SHOULD GO WITH THE TREND When prices are rising, it is normal for volume to expand, and when prices are declining, volume typically contracts, as can be seen in Figure 1. Figure 2 reveals that when we refer to rising or contracting volume, we mean the overall trend of volume, not individual sessions. The green arrows mark the trend, which is an expanding one. Within that trend, though, there are individual sessions, such the two flagged by the red arrows, where volume is below the surrounding days. When prices are rising and the volume is expanding, market action will not tell us much, except to say that this is a normal state of affairs and the uptrend is soundly based. However, when prices rise but the volume trend is down, as can be seen in Figure 3, that is abnormal, warning us that rising prices are being fueled more by the lack of selling than the enthusiasm of new and aggressive buyers. Most of the time, you will find bear market rallies being associated with a trend of declining volume, such as that shown in Figure 4, where volume contracts as the short-term bear market rally develops. |
|
| FIGURE 3: CONFIRMATION FAILURE. Should you see something like this, you'll be forewarned that the price increase is unsustainable. |
| |
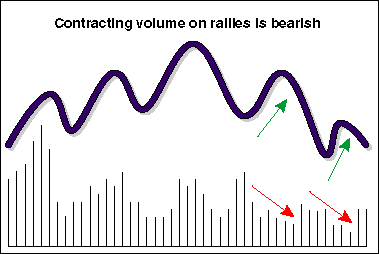 FIGURE 4: BEAR MARKET RALLIES. A confirmation of a bear market is declining volume during rallies. Just as falling volume and rising prices are abnormal, so are declining prices and expanding volume. In a healthy market, prices and volume contract together, more because of a lack of buying than a preponderance of selling. However, when prices decline and volume expands, it tells us that downside pressure is present because sellers are aggressive, which is not a good portent for future prices. In this regard, Figure 5 shows how volume starts to pick up as the price starts to decline. This is a subtle sign, but an important one, nonetheless, because it tells us that the sellers are getting anxious. Since prices are declining, it also informs us that buyers are not enthusiastic enough to pick up the slack. Quite often, you will see a situation following a rally where prices start to slip. You will often see that on the first or second day after this happens, volume picks up noticeably. This, too, is abnormal and again flags a danger signal, since it indicates that prices are falling due to the sellers' urgency rather than falling of their own weight because buyers are not buying. 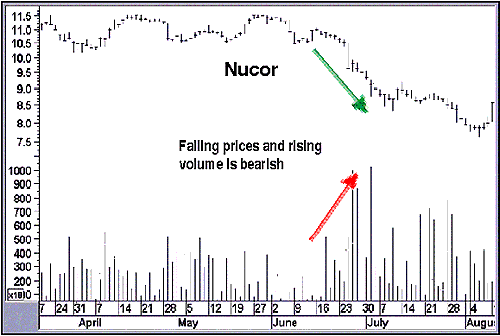 FIGURE 5: NUCOR. Volume picks up after a slide, a warning signal that the downward pricing is stimulating anxiety to sell. |
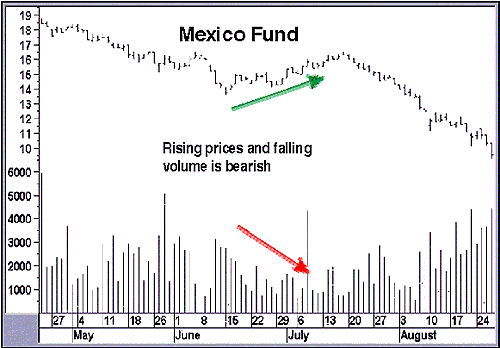
| VOLUME LEADS PRICE DURING RALLIES It is normal for a peak in prices to be preceded by a peak in volume. In Figure 6, you can see that the volume peaks at A but the price tops out at C. The level of volume at C is less than that at A and B. At point B, a negative divergence between price and volume developed as prices moved higher and the peak in volume moved lower. This type of action tells us that prices are no longer being supported by an influx of enthusiastic buyers and that the prevailing trend is suspect. Figure 7 shows an example featuring the Mexico Fund, a closed-end fund listed on the NYSE. You can see how the price continues to advance under the guise of ever-decreasing volume. 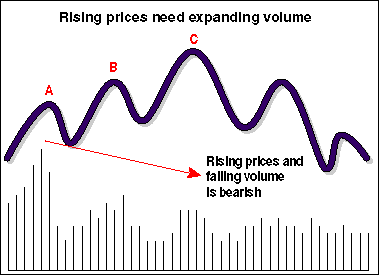 FIGURE 6: VOLUME LEADS PRICE DURING RALLIES. Volume will often top out before prices. Indeed, a leading indicator of a top is the failure of volume to confirm price advances. 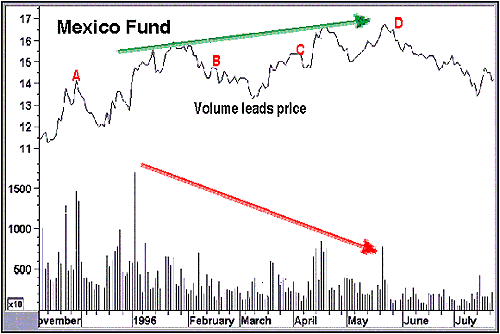 FIGURE 7: MEXICO FUND. Even though prices struggled higher, the declining volume signaled a decline in interest rates that manifested eventually in declining prices. Figure 8 displays two interpretive principles. First, we see the concept of volume leading price. Second, note how volume expands noticeably on the first two days of the decline. As discussed, this is abnormal because volume is not going with the trend, and therefore, that is a bearish sign. 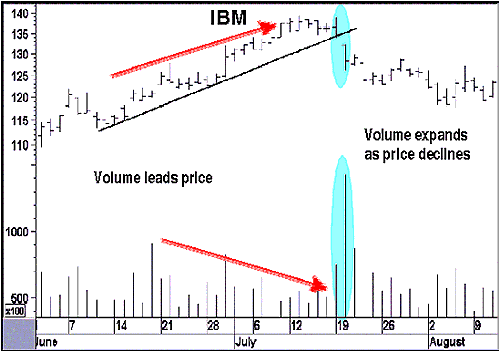 FIGURE 8: IBM. As prices rose, volume trended downward, presaging a price decline. |
| SELLING CLIMAX Dramatically expanding volume following a price decline usually signals a selling climax. Figure 9 shows a market where the price declines for a while and then reverses as volume expands significantly. This is a selling climax and represents a clearing-out of overhead supply. Such declines are typically triggered by bad news, which prompts weak and uninformed holders to sell at any available price. Once the price has been marked down sufficiently, buyers who are more informed and able to look past the bad news begin to pick up the surplus supply, and the price then reverses to the upside. 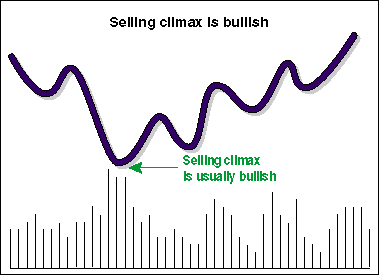 FIGURE 9: CLIMAX. A good signal of a bottom is large relative volume accompanying a price decline. Selling climaxes either represent the bottom or are followed by a rally and a subsequent move to a new low. In either case, the bottom marked by the selling climax usually holds for a considerable length of time. What represents "a considerable time" will depend on the time span of the chart. Clearly, a selling climax on an intraday chart will be nowhere near as powerful as a selling climax on a monthly chart. Since the selling attracts a huge amount of volume, it is only natural that the subsequent rally will be accompanied by declining volume. This is one of the few instances where rising prices on declining volume is actually a bullish factor. Figure 10 shows that the rally following a selling climax is often followed by a test of the selling climax low. The tipoff that the test will be successful can be seen from the fact that volume dwindles to almost nothing, indicating a distinct lack of interest compared to the tremendous excitement at the previous low. The lack of interest at the second bottom typifies a very fine balance between buyers and sellers. Consequently, when the rally starts, it usually represents the early stages of a major move. 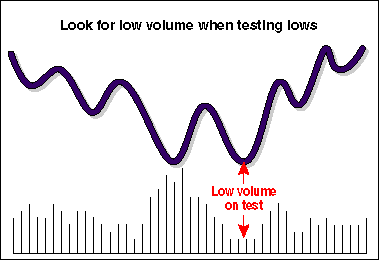 FIGURE 10: REBOUND. One time a price advance might be accompanied by low volume is when it is coming off the low. OFF A LOW Figure 11 shows a rally taking place after a major decline. However, the volume expands to a record level. This type of action is almost always a tipoff that a complete reversal in market sentiment is under way. Examples that come to mind are record volume for the NYSE coming off the 1982 and 1984 bear market lows, and the intermediate low of October 1998. The same thing happened for bond futures in October 1998. This type of market action does not happen very often, but when it does, it should never be dismissed out of hand. 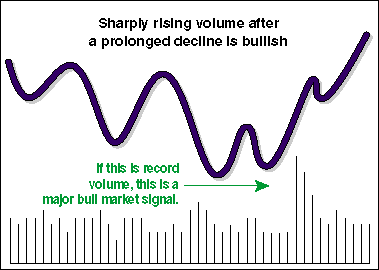 Figure 11: Off a low. RECORD VOLUME COMING OFF AN IMPORTANT LOW IS USUALLY A PRECURSOR OF A MAJOR RALLY. In Figure 12, we see a parabolic rally in both price and volume. Such action typically indicates exhaustion once it has run its course. In such instances, it is normal for price and volume to reverse simultaneously at the same kind of speed that was associated with the end of the previous advance. 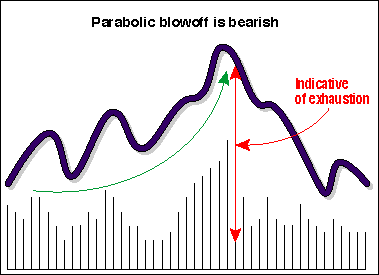 FIGURE 12: BEARISH BLOWOFF. A parabolic move in price and volume is bearish. IN SUMMARY SUGGESTED READING International Institute for Economic Research, http:// www. pring.com. Pring, Martin J. [2000]. Breaking The Black Box, A CD-ROM Tutorial, International Institute For Economic Research. _____ [1998]. Introduction To Technical Analysis, McGraw-Hill Book Co. _____ [1985]. Technical Analysis Explained, McGraw-Hill Book Co. |
Martin J. Pring founded the International Institute for Economic Research in 1981. He is the author of several books, including the classic Technical Analysis Explained, and Introduction To Technical Analysis, the first technical analysis multimedia CD-ROM. He pioneered the introduction of videos as an educational tool for technical analysis in 1987, and was the first to introduce educational interactive CDs in this field.
| Address: | PO BOX 624 |
| Gloucester, VA 23061 | |
| Fax: | 804 694-0028 |
| Website: | www.Pring.com |
| E-mail address: | info@Pring.com |
PRINT THIS ARTICLE

Request Information From Our Sponsors
- StockCharts.com, Inc.
- Candle Patterns
- Candlestick Charting Explained
- Intermarket Technical Analysis
- John Murphy on Chart Analysis
- John Murphy's Chart Pattern Recognition
- John Murphy's Market Message
- MurphyExplainsMarketAnalysis-Intermarket Analysis
- MurphyExplainsMarketAnalysis-Visual Analysis
- StockCharts.com
- Technical Analysis of the Financial Markets
- The Visual Investor
- VectorVest, Inc.
- Executive Premier Workshop
- One-Day Options Course
- OptionsPro
- Retirement Income Workshop
- Sure-Fire Trading Systems (VectorVest, Inc.)
- Trading as a Business Workshop
- VectorVest 7 EOD
- VectorVest 7 RealTime/IntraDay
- VectorVest AutoTester
- VectorVest Educational Services
- VectorVest OnLine
- VectorVest Options Analyzer
- VectorVest ProGraphics v6.0
- VectorVest ProTrader 7
- VectorVest RealTime Derby Tool
- VectorVest Simulator
- VectorVest Variator
- VectorVest Watchdog
