HOT TOPICS LIST
- Strategies
- Stocks
- Buy
- Investing
- Brokers
- Psychology
- Interviews
- Accumulate
- Sell
- Hold
- Spotlight
- Websites
- Candlestick Corner
- Gold & Metals
- Options Trading
LIST OF TOPICS
TRADER'S NOTEBOOK
Observing Market Behavior
08/05/03 11:40:30 AM PSTby Dennis D. Peterson
You can find out all sorts of interesting and useful things if you explore new types of data.
| The market isn't all zigs and zags with prices randomly moving up and down. If you know where to look, you can find some underlying, reasonably well-behaved movement. Just what is "well-behaved" movement, you ask? By this, I mean behavior that isn't all over the map, bouncing between extremes. Well-behaved movement isn't necessarily predictable, but the data follows a relatively smooth and predictable path. Of course, as traders, what we are after is predictability. My purpose here is to make you aware of a couple of market observations you may not be familiar with, and encourage you to explore on your own. This may mean investing in software that allows you to create your own indicators and trading schemes, but there is more you can do. My interest in the search for well-behaved market movement stems from wanting to succeed as a trader and from trying to make use of a couple of seemingly indisputable facts. First, what are the odds that tomorrow will be an up day versus a down day? Generally speaking, the odds are 50/50. From this you might conclude that the market tries to keep price movements — ups and downs, regardless of their magnitude — about equal in terms of occurrence. Second, if you like to use the relative strength index, realize that you are basing your calculations on data that is filtered based on whether days are up or down. This may mean you are naturally attracted to some of the market breadth indicators because they filter in a similar way — that is, the number of daily advancers and decliners for a particular market (for example, the Nasdaq). Keeping in mind what price data looks like (chaos, some would say), I'd like to share a couple of observations. The McClellan oscillator is a popular indicator that uses the difference between advancing and declining stocks. More specifically, it calculates the difference of two exponential moving averages of the number of advancing/declining stocks. But what if you simply calculated the daily difference between advancing and declining stocks, and summed these daily differences on a cumulative basis? On days when the number, or count, of advancing stocks is greater than the count of declining stocks, the number added to the sum is positive. On those days that finish with the number of decliners leading advancing stocks, the number added to the sum is negative. What do you think the running sum of the data would look like?
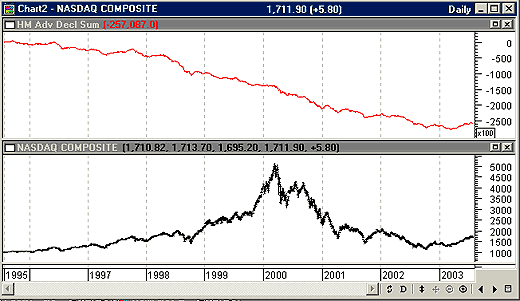
ADVANCERS MINUS DECLINERSTake a look at Figure 1. Are you surprised that the running sum is a gradual descent starting eight years ago? The sum naturally starts at zero, and instead of bouncing around, it goes down from there. I arbitrarily loaded eight years of data, but it is possible the downslope may have started earlier. At any rate, you can see that the recent two months of behavior are not the norm.
Figure 1: Daily Nasdaq Composite (bottom) and running sum of the daily difference of Nasdaq advancing/declining stocks (top). Although the Nasdaq Composite saw a major peak in 2000, preceded by a long gradual climb up through much of the 1990s, on balance the running sum is negative. Since 1995 there were almost always more declining stocks than advancing ones.
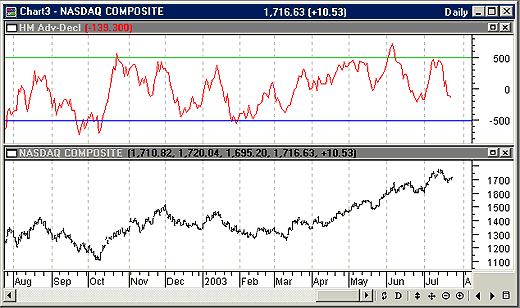
As always, what you are looking for is an edge over your fellow traders. You can't expect to find the holy grail of solutions, but modest insights can be incorporated into your trading. With that in mind, you can expect to make small steps toward getting that edge. Here's what I see in Figure 1. The data isn't bouncing around much, and if I overlay a 10-day moving average on the raw data, the two are almost indistinguishable. Suppose I use a 10-day moving average of advancers minus decliners. This calculation results in an oscillator for determining overbought versus oversold conditions (Figure 2). The behavior of the data shows that it oscillates, and therefore there are two key ways to use this data: by trading the overbought and oversold extremes, or by looking for divergences.
Figure 2: 10-day single moving average of Nasdaq advancing/declining stocks (top) and daily Nasdaq Composite (bottom). Looking at where the single moving average reaches an extreme of -500, you can see that the Nasdaq was oversold and ready for a modest rally. Even in a secular bullish market, stocks that become overbought can stay overbought, which is the behavior you see when the upper extreme of +500 is used. Therefore, you may conclude that there is some legitimacy in using an average of advancing minus declining stocks as an oscillator.
Helene Meisler of TheStreet.com has a useful refinement. What she does is look at the individual daily differences and determine what kind of older (past data) differences are replaced by the newer (more recent) ones. For example, if all of the older differences are large negative numbers, it's likely that the moving average will turn up. Now, you can add that over time there have been more declining stocks than advancing ones, and therefore more, or bigger, negative differences — except for the current two months, which show a bias toward more positive differences. Don't you love it when you see something that has been going on for eight years — only to find out that it is currently doing the opposite? If this is too much to believe, consider this: The count includes all of the stocks that have taken big declines and are now sitting around the bottom not doing much. If the majority of stocks had advanced, then the majority of traders should have won — versus the 5% who actually succeeded.
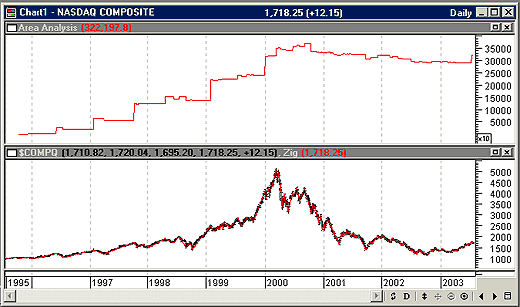
UPSWINGS AND DOWNSWINGSThe genesis of this exploration was a phrase I read in an old article that said something like, "Prices tend to balance out above and below the median line of an Andrews pitchfork." That's a paraphrase, but here's what I want to get to: What would the running sum of upswing and downswing areas look like? Andrews pitchfork medians are slanted, either up or down, so this is going to be an approximation; I am not going to worry about the slant. Instead, I will define an area as the price change times the number of price bars between these two values. If the price change is positive, the area is positive, and if the price change is negative, the area is negative. I will then simply make a running sum of the areas. How will this look? Will it bounce all over the map, steadily increase or decrease, move along horizontally? The first thing to observe (Figure 3) is that prior to the year 2000 there were large steps in the running sum, and since then the sum has been roughly constant. What happened? I am using a 5% zigzag to define upswings and downswings. The zigzag is creating the peaks and valleys that will become my areas: I count the price bars in going from a valley to a peak, then multiply by the price change to get a positive area, then go from a peak to a valley for a negative area. It's clear that market price volatility has changed since 2000. You can see that positive and negative areas nearly cancel themselves out after 2000.
Figure 3: Daily Nasdaq and running sum of areas. Areas are defined to be the product of the number of price bars times the price change. Positive and negative price changes cause the areas to be positive or negative. The price change is defined to be a 5% zigzag. Prior to 2000, prices rose without 5% retracements for extended periods, creating big steps in the chart. After 2000, market volatility increased to the extent that a 5% change was frequently exercised, but instead of steadily going down from 2000 as prices went down, the running sum has been roughly horizontal.
Yes, the market wants to stay balanced in terms of the positive and negative areas. In the market prior to 2000, a 5% zigzag was big enough to hide the retracements. The increased market volatility of the post-2000 market shows you that it will not (at the moment) let itself get too far out of balance at the 5% change level in terms of area.
SUMMARYAs I noted at the beginning, this isn't the whole story on observing market behavior. The trick is not to keep massaging price data in endless variations, but to start thinking about different approaches, such as new ways of filtering or even examining something like the swing areas defined here. You can usually find a way to take these observations and incorporate them into your trading.
Dennis Peterson may be reached at DPeterson@Traders.com. MetaStock (Equis International), eSignal (data)
Current and past articles from Working Money, The Investors' Magazine, can be found at Working-Money.com.
|
Market index trading on a daily basis.
| Title: | Staff Writer |
| Company: | Technical Analysis, Inc. |
| Address: | 4757 California Ave SW |
| Seattle, WA 98116-4499 | |
| Phone # for sales: | 206 938 0570 |
| Fax: | 206 938 1307 |
| Website: | working-money.com |
| E-mail address: | dpeterson@traders.com |
Traders' Resource Links | |
| Charting the Stock Market: The Wyckoff Method -- Books | |
| Working-Money.com -- Online Trading Services | |
| Traders.com Advantage -- Online Trading Services | |
| Technical Analysis of Stocks & Commodities -- Publications and Newsletters | |
| Working Money, at Working-Money.com -- Publications and Newsletters | |
| Traders.com Advantage -- Publications and Newsletters | |
| Professional Traders Starter Kit -- Software | |
PRINT THIS ARTICLE

Request Information From Our Sponsors
- StockCharts.com, Inc.
- Candle Patterns
- Candlestick Charting Explained
- Intermarket Technical Analysis
- John Murphy on Chart Analysis
- John Murphy's Chart Pattern Recognition
- John Murphy's Market Message
- MurphyExplainsMarketAnalysis-Intermarket Analysis
- MurphyExplainsMarketAnalysis-Visual Analysis
- StockCharts.com
- Technical Analysis of the Financial Markets
- The Visual Investor
- VectorVest, Inc.
- Executive Premier Workshop
- One-Day Options Course
- OptionsPro
- Retirement Income Workshop
- Sure-Fire Trading Systems (VectorVest, Inc.)
- Trading as a Business Workshop
- VectorVest 7 EOD
- VectorVest 7 RealTime/IntraDay
- VectorVest AutoTester
- VectorVest Educational Services
- VectorVest OnLine
- VectorVest Options Analyzer
- VectorVest ProGraphics v6.0
- VectorVest ProTrader 7
- VectorVest RealTime Derby Tool
- VectorVest Simulator
- VectorVest Variator
- VectorVest Watchdog


