HOT TOPICS LIST
- Strategies
- Stocks
- Buy
- Investing
- Brokers
- Psychology
- Interviews
- Accumulate
- Sell
- Hold
- Spotlight
- Websites
- Candlestick Corner
- Gold & Metals
- Options Trading
LIST OF TOPICS
Are You Trading On Borrowed Time?
08/12/03 03:56:36 PM PSTby Matt Blackman
The market party peaked at midnight and it's now 4:00 am. Someone has just arrived with a fresh round of drinks. But here are some sobering thoughts for those getting their second wind.
| Usually, short-term traders don't care whether markets are going through uptrends or downtrends. With a time horizon no longer than a few hours at most, the primary trend offers little help to traders in choosing entry and exit points. Of greater interest to those traders is the daily trend. Fundamentals, other than scheduled daily economic and earnings reports, are also relatively low on the priority scale. Technicals carry the greatest weight in executing trades. As the trading timeline lengthens, so does the trader's focus. For trades lasting weeks or longer, major trends and market fundamentals become more important. Chart technicals contribute the greatest assistance in timing entries and exits, provide warnings of potential buying or selling opportunities, and help the investor monitor overall market health, but fundamentals are of greater significance in making decisions. However, can short-term traders ignore market and economic fundamentals if they own a home, have a longer-term stock portfolio, 401(K), IRA, education fund, or other retirement account? What's the point of working like a dog to build a trading account, only to watch your retirement savings get wiped out? If the bear market has taught the investing public anything since 2000, it is that the "buy, hold, and ignore" approach can be detrimental to our financial health.
THE FLY IN THE OINTMENTMany believe that the worst days in the market are behind us. In the hubbub and celebration that started with the latest bottom in March 2003, bearish opinions are being more or less ignored. But like ignoring the little voice in our heads that helps us separate right from wrong, failure to pay heed to contrarian opinion in these volatile times can be downright dangerous. This is especially true when bearish arguments are based on sound economic and technical principles. Charlie Minter and Marty Weiner of Comstock Partners are two such voices in the wilderness, and they have a briefcase load of data to support their position. Since the late 1990s, Minter and his partner have been committed bears. A frequent guest on CNBC and the Nightly Business Report, Minter proffers a relatively simple message. In the 40 years prior to 2001, every time the Federal Reserve lowered interest rates, the market was up one year later. But that all changed in 2001. In 2001, 11 rate cuts and more than $1 trillion in tax cuts failed to jump-start the economy. More than $7 trillion was lost in the stock market drop in the US, and investors worldwide lost more than $12 trillion when the stock market plunged. In adjusted dollar terms, the meltdown was worse than what happened in the US in 1929 and in Japan in 1989-90. Short-term economic and fiscal policies like rate reductions and tax cuts did not cure the underlying problems. Every meltdown was due to one predominant cause, in Minter's opinion: Debt overwhelmed the system. And there are some disturbing debt parallels between the US today with the US in 1929 and Japan in 1989-90. Before we explore this issue, let's examine what current market technicals are telling us.
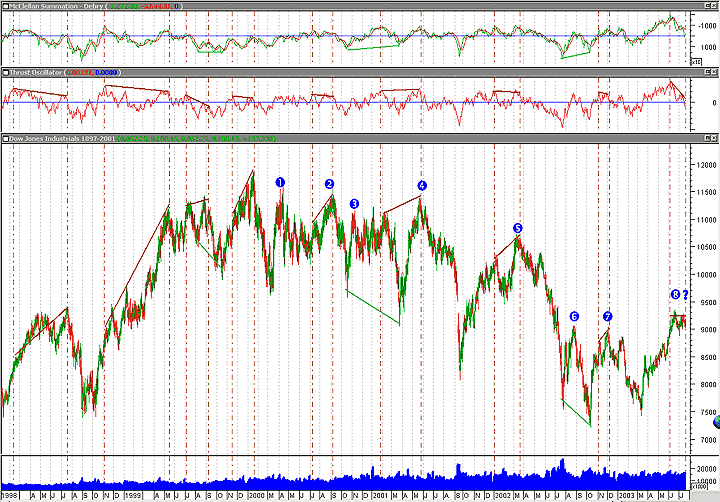
LOOKING FOR CLUESThe latest move up is the eighth rally since the market peaked in 2000 (see Figure 1). In all, the market has rallied 12 times since 1998, and in nine out of 12 of those moves, an indicator called the thrust oscillator, a derivation of the Arms index or TRIN, provided warning in the form of negative divergence with price.
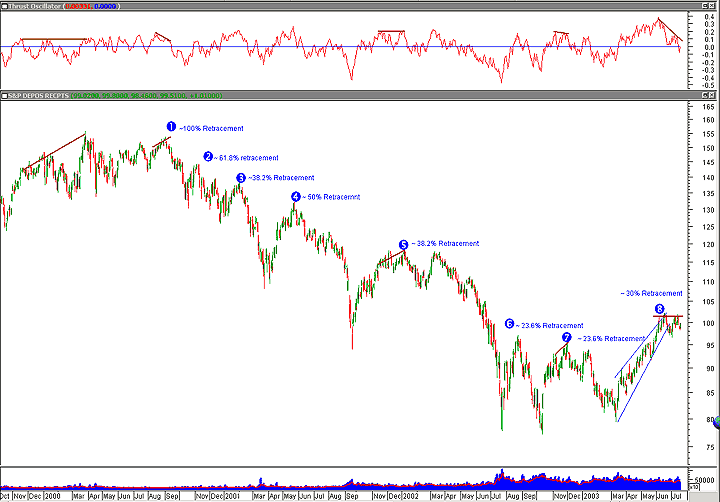
Figure 1: Daily chart of the Dow Industrial Average ($INDU) showing the bear rallies since 2000. The thrust oscillator (TO) provided warnings in eight out of 11 market tops since 1998 (brown divergence lines). Charts provided by MetaStock. The thrust oscillator warned in four out of the last eight rallies since the market peaked in 2000, giving the latest warning (at time of writing) in mid-July 2003. Between market peak and rally 7 in 2002, the average retracement from peak to the next low was 120%. The net result was that the market was 20% lower once each rally petered out. Those who took the bull by the horns in mid-March 2003, however, enjoyed a pleasant ride into July, with the Dow Jones Industrial Average gaining more than 20%, the Standard & Poor's 500 up 25% and the tech-driven Nasdaq jumping nearly 40% from prior lows. These are impressive moves, but the question remains: Is this just a pause in a new bull market, or is bear rally 8 waiting to sucker-punch investors, like bear rally 7? The thrust oscillator and the McClellan summation index are warning of a top and so is the double-top pattern that formed on the daily S&P 500 chart at around the same time (see Figure 2).
Figure 2: Daily chart of the Standard & Poor's Depositary Receipts (SPY), considered by many to be an excellent overall market proxy showing the market peak and eight subsequent rallies.
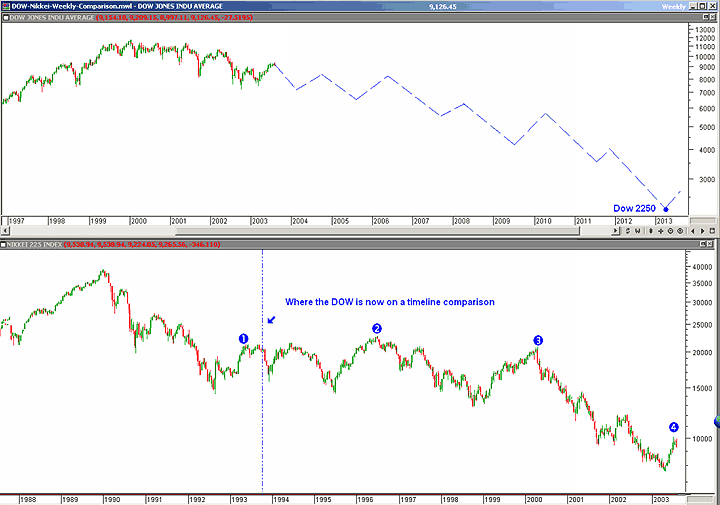
IT COULD NEVER HAPPEN HERE COULD IT?Or could it? To answer that question, let's take a brief look at history. The Nikkei 225 hit a high of 38,957 on December 29, 1989. It experienced at least 10 sizable bear rallies over the following 13 years before hitting a low of 7,608 on April 28, 2003. In three of those rallies between 1992 and 2000, the Nikkei jumped an average of more than 50% from previous lows each time, the largest soaring more than 60% before the index eventually reversed to hit new lows again (see Figure 3).
Figure 3: Weekly charts comparing Dow Jones Industrial Average (DJIA) with the Nikkei 225 (N225). Numbers 1 through 3 indicate rallies that witnessed gains of 50% or more in the value of the index. Based on the debt similarities between the two countries, the comparison is not far-fetched.
At the height of the Japanese market in 1989, Japanese banks were lending money secured by real estate at values greater than current selling prices in anticipation that prices would continue to go higher. Investors took the borrowed money and plowed it into the stock market. The challenge came when real estate values began to fall. Say that a large number of investors own stocks secured by property that is mortgaged at 100% or more of its value. As property values drop, the property cannot be sold to cover stock market losses, since the equity's worth has evaporated. Investors have no choice but to sell shares to cover margin calls. As property values continue to drop (and investors panic and sell), so does the stock market. A snowball effect has begun. What happens next? Bank loan losses mount, pressuring further property and stock sales. The collapse exposes market excesses. Banks and the economy are the ultimate casualties. Thirteen years later, the Nikkei 225 has plunged more than 80% from 1989 highs. It is no coincidence that urban land prices in Japan have also fallen by as much as 80% since the early 1990s.
A TALE OF TWO ECONOMIES
Comparisons between the Dow Jones industrials and the Nikkei become more plausible when debt levels in both countries are examined before each peak. Does it seem far-fetched to imagine the Djia falling to 2250? Could it happen here? In some cases, Japan was in worse shape in 1989 than the US is today. But in many ways, the US is in worse shape today than Japan was then. Here is a list of comparisons:
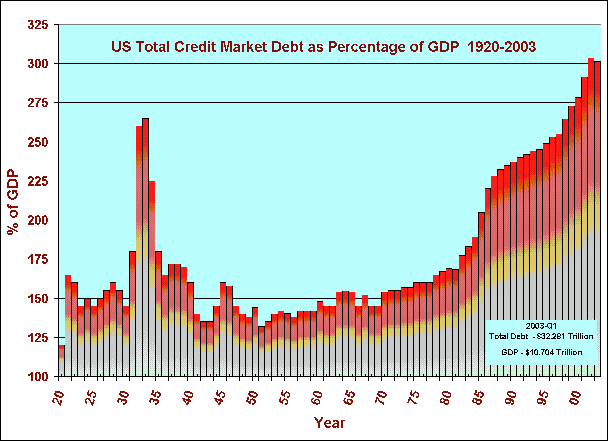
Figure 4: Total debt in the US as a percentage of Gross Domestic Product. It hit a peak of 265% in 1929 but stands at more than 300% today.
When the numbers are compared, there are more similarities than there are differences between the two nations. In a number of crucial categories, the US is in worse shape than Japan was in 1989. The source of true concern is total credit market debt (see Figure 5).
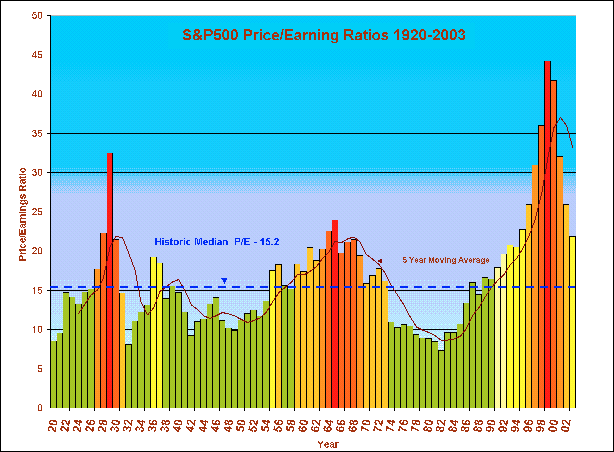
Figure 5: Price/earnings ratios from 1920 to 2003 showing a median price/earnings ratio of 15.2. There are exactly 35 years between peaks. Assuming a similar peak to trough pattern will occur again, we should see P/Es below the historic mean again (blue dashed line) by 2010, if not sooner.
CONNECTING THE DOLLAR SIGNSA drop in real estate prices was the catalyst that began the recession in Japan more than 13 years ago. Could it be the start of a similar meltdown here? Real estate prices are at all-time highs in many regions of the US. It would be logical to expect that homeowner equity would be too, but the opposite is true. In this country, homeowner equity is at its lowest level in years. It has been used to collateralize debt (see Figure 6).
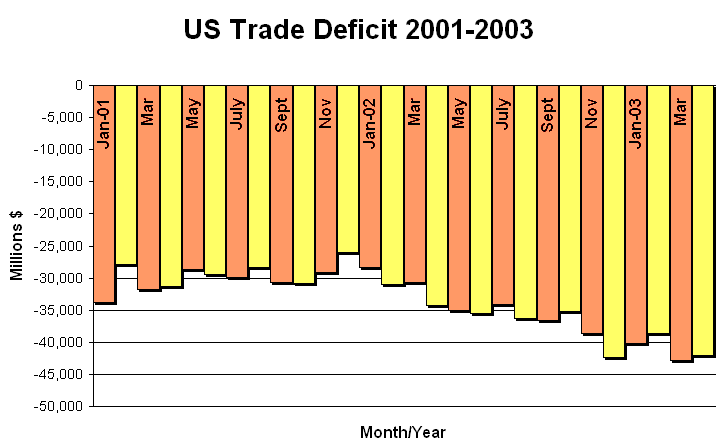
Figure 6: Growing trade deficit even in the wake of a falling dollar. Source: US Commerce Dept. Let's look at one possible scenario. Corporate earnings and economic news fail to inspire investors to buy more stock, causing stock prices to begin to fall. This is not hard to imagine for two reasons. First, investor expectations are extremely high based on current valuations. To maintain current stock prices, sentiment must remain bullish. Second, there are scant signs of an increase in capital spending by corporate America, one of the surest signs of an economic recovery. Earnings are being driven by cost-cutting measures, not top-line growth. This results in further layoffs and will ultimately affect consumer spending and the public's ability to borrow. A drop in stock prices causes foreign investors to seek better returns elsewhere. Since bond prices have dropped, yields are increasing in an attempt to attract enough foreign capital to finance the US's credit needs. This pushes consumer and mortgage lending rates up. This trend has already begun in long-term bonds and is putting upward pressure on five- to 10-year mortgage rates. Five-year mortgage rates, which are sitting at 5%, increase to 6%, driving up monthly mortgage payments 20%. This knocks about 20% of the first-time buyers out of the market because they can no longer afford to buy. Those with homes in lower price ranges find it more difficult to sell and the real estate market begins to stall. In a hot real estate market, buyers are pressured into buying a home before they sell the one they currently own. In a rising market, this strategy means a higher selling price, so those moving up ignored the potential risks. Now that the market has stalled and mortgage rates are rising, home buyers have no option but to sell a home at whatever the market will bear. Not wanting to be caught, they put both on the market to see which one they can sell first. Prices begin to drop as housing supply jumps and demand shrinks. First-time buyers and those who are mortgaged to the hilt, who are taking out variable-rate mortgages with lower initial payments, are hit as interest rates rise. Having bought with minimum down payments of 5% to 10% of appraised value and with inflated housing prices dropping, they walk away from mortgages that have become greater than the value of the home. Many will declare personal bankruptcy, leaving the banks to sell their homes, further adding to a ballooning housing supply. Speculators and investors who bought in anticipation of a quick profit race to put these homes back on the market, hoping to cash in before the market drops further. Many own five or more homes, all highly leveraged. Caught in the double bind of increasing short- term mortgage rates and dropping prices, they find it increasingly difficult to make payments. Time, which had been their ally in a rising market, now becomes their enemy. They sell whatever they can to stay afloat, and that includes stock holdings. Speculators and those who took out home equity loans to take advantage of the rising stock market become big sellers of stock in an effort to cut costs and cover margin calls. Bears, sensing panic, close in for the kill and begin short-selling with a vengeance. The downward spiral has begun, with real estate prices falling in sympathy with stock prices. KEEPING THE DEBT DOGS AT BAYSound far-fetched? It happened in Japan in 1989-90, in North America in 1981-82 (when mortgage rates jumped from around 12% to 22% in the span of approximately six months) and in 1929. Could it happen again? You be the judge. An individual, corporation, or nation heavily burdened with debt can continue to make payments and carry the load as long as the economy is growing, prices are rising, and money is coming in. The larger the debt burden, the greater the vulnerability to changing conditions. In 1929, the debt threshold was 265% of GDP. For Japan in 1989, it was approximately 250% of GDP. What is the critical number for the US today? How much debt can the US economy carry before it is overwhelmed? As well as overall record debt, there are two disturbing facts about the most recent recession that cannot be overlooked. The bull market between 1982 and 2000 was the longest in history resulting in the largest increases in market valuations. Yet the recession that immediately followed was the mildest in history. Valuations are still historically high. More importantly from a debt perspective, in every prior recession, private debt has fallen in real terms. But throughout the last recession it has continued to soar along with government and current account deficits. What will it take to restore the proper equilibrium, rid the economy of pent up excesses and reduce overall debt? What if the recession between 2000 and 2003 was just a hiccup and the real recession has not yet occurred? It is no secret that the Fed has opened the money supply floodgates in another attempt to stem the deflation tide. The last thing President Bush needs is to have a second economic meltdown on his watch, and his administration is doing everything in its power to revive the economy before the November 2004 Presidential election. But the longer that rates are kept artificially in check against the rising tide of money supply, the greater the debt burden and risk of inflation. It only delays the inevitable credit crunch and eventual meltdown, as we witnessed in the late 1970s and early 1980s. How long Federal Reserve chairman Alan Greenspan and company can maintain the status quo remains to be seen, but they have done a laudable job so far. Can the Fed continue to flood the market with dollars while maintaining tight control on inflation until the election? And will that be enough to jump-start the economy? When the Treasury tap is closed, it will have to be done with great care. The last time money supply was allowed to run freely was in anticipation of the new millennium to stem potential Y2K damage. When money flow was reduced again in 2000, the markets plummeted. There is a razor-thin line on which the US economy status quo rests, with a hyperinflation mountain on one side and the deflationary debt abyss on the other. All three scenarios will require vastly different trading/investment strategies. After weighing the data and comparing scenarios throughout history, Minter and Weiner of Comstock Funds have placed their bets. They are 100% short the market and have been for months. No one knows, including Minter and Weiner, when the correction is coming, but they are ready.
Matt Blackman is a trader, technical analyst, software reviewer, and content provider for technical trading/investment websites. He is an affiliate member of the Market Technicians Association (MTA) and Canadian Society of Technical Analysts (CSTA), and is currently enrolled in the Chartered Market Technicians (CMT) program.
SUGGESTED READINGBlackman, Matt [2002]. "10 Challenges Facing A Market Rebound," Working Money: December 17.Hawkins, David [2003]. "Find Those Market Tops," Technical Analysis of Stocks & Commodities, Volume 21: July. Minter, Charles [2003]. "Greenspan Is In A Bind Deflation Will Be Final Result," June 24. http://www.comstockfunds.com The Economist [2001]. "Another False Dawn?" March 22. _____ [2003]. "Breaking The Deflationary Spell," June 26. _____ [2001]. "Debt Trap!" January 25. _____ [2002]. "Dicing With Debt," January 24. _____ [2000]. "Into The Whirlwind," January 20. _____ [1999]. "Japan's Debt Menace," June 3. _____ [2003]. "Seeking The Right Medicine," June 19. MetaStock (Equis International); US Commerce Department
Current and past articles from Working Money, The Investors' Magazine, can be found at Working-Money.com.
SIDEBAR:
McClellan Oscillator (Debry) NYSEAdvDec = NYSE Advancing Issues - Declining Issues,
McClellan Oscillator = 19 Day Exponential Moving Average NYSEAdvDec - 39 Day Exponential Moving Average NYSEAdvDec,
McClellan Summation Index = McClellan Oscillator - (10 x 19 Day EMA NYSEAdvDec) + (20 x 39 Day EMA NYSEAdvDec)) + 1000;
Plot McClellan Summation Index.
Thrust Oscillator (TO) ai = NYSE Advancing Issues; ds = NYSE Declining Issues; av = NYSE Up Volume; dv = NYSE Down Volume;
TO = ((ai*av)-(ds*dv))/((ai*av)+(ds*dv));
Plot 22 day Exponential Moving of TO.
|
Matt Blackman is a full-time technical and financial writer and trader. He produces corporate and financial newsletters, and assists clients in getting published in the mainstream media. He tweets about stocks he is watching at www.twitter.com/RatioTrade Matt has earned the Chartered Market Technician (CMT) designation.
| E-mail address: | indextradermb@gmail.com |
PRINT THIS ARTICLE

Request Information From Our Sponsors
- StockCharts.com, Inc.
- Candle Patterns
- Candlestick Charting Explained
- Intermarket Technical Analysis
- John Murphy on Chart Analysis
- John Murphy's Chart Pattern Recognition
- John Murphy's Market Message
- MurphyExplainsMarketAnalysis-Intermarket Analysis
- MurphyExplainsMarketAnalysis-Visual Analysis
- StockCharts.com
- Technical Analysis of the Financial Markets
- The Visual Investor
- VectorVest, Inc.
- Executive Premier Workshop
- One-Day Options Course
- OptionsPro
- Retirement Income Workshop
- Sure-Fire Trading Systems (VectorVest, Inc.)
- Trading as a Business Workshop
- VectorVest 7 EOD
- VectorVest 7 RealTime/IntraDay
- VectorVest AutoTester
- VectorVest Educational Services
- VectorVest OnLine
- VectorVest Options Analyzer
- VectorVest ProGraphics v6.0
- VectorVest ProTrader 7
- VectorVest RealTime Derby Tool
- VectorVest Simulator
- VectorVest Variator
- VectorVest Watchdog

