

HOT TOPICS LIST
- Strategies
- Stocks
- Buy
- Investing
- Brokers
- Psychology
- Interviews
- Accumulate
- Sell
- Hold
- Spotlight
- Websites
- Candlestick Corner
- Gold & Metals
- Options Trading
LIST OF TOPICS
Options Calculator
08/20/03 03:30:06 PM PSTby Dennis D. Peterson
A handy device -- available free.
| Someone asked me the other day if I could help him find out what his stock option was worth. He had gotten the option through work, and a large brokerage firm was offering him cash for it. In fact, the company he worked for had authorized this brokerage to make the offer to its employees. The option was a call, a contract giving him the right to buy stock at a specific price. If it had been a put, then the employee would have had the right to sell stock at a specific price. Options are bought and sold, and most employees who have options own calls.
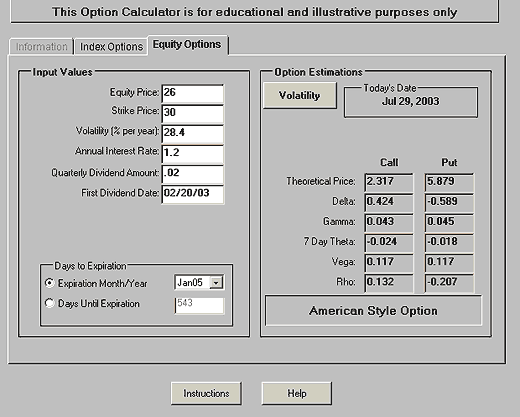
OPTIONS BASICSOptions are contracts that confer to the owner the right to buy or sell at a certain price. You can calculate their cost by taking the premium times 100, because options contracts are for 100 shares, and the premium is the cost per share. Since contracts are bought and sold, you will see the bid and ask for quotes of the premium. Sometimes the bidding on a particular contract is not active and you might see a "pc," which is shorthand for prior quote; that could be days old. Look in the open interest column to find how many contracts have been bought/sold. In any event, contracts are either a call or put. Either type specifies the price at which you have the right to buy or sell and it specifies an expiration date. This specific price is called the strike price. Strike prices are chosen at convenient even values such as $25 or $30 (currently $2.50 increments for underlying stock prices under $25/share, $5 increments for those over $25, and so on). If you see an option such as "MSFT May 30 call," it's the contract to buy shares of Microsoft stock for $30 per share by the end (almost) of May. Stock contracts officially expire on the Saturday following the third Friday of the month, and for indexes they expire on the Thursday prior to stock expiration. The Options Clearing Corp. (OCC) uses Saturday to balance the books, so the third Friday of the month for the outside world is the last day for an options contract. Options are traded at a number of exchanges. The OCC provides free help and a website (call 888 Options or visit www.888options.com). Getting back to the original problem, what is your call option worth? There are options calculators available to help you get an estimate, two of them include one from the Chicago Board Options Exchange (CBOE) website and another at the OCC website. I ended up using the one at the CBOE website (www.cboe.com/tradtool/optioncalculator.asp) for this article (Figure 1).
Figure 1: CBOE options calculator. The calculator, which can be found at the CBOE website under the Trading Tools tab, allows you to calculate a premium price for both index and stock options. Selecting Equity Options provides a JavaScript for premium price calculation. The calculator field, called "Theoretical price," is the premium price, but is theoretical only, since the bid/ask premium price may be different.
The first time you see an options calculator, it might make you say, "What is all this stuff?" Don't worry yet about the Greek alphabet on the right-hand side of the calculator (which is explained with the Help button on the lower right); it's the left-hand side that requires your inputs.
INPUT VALUESSelect the Equity Options Tab for stocks — index options are another story. Start by entering the current stock price. In this example I am going to use Microsoft stock. I used a rough estimate of $26 per share for the current price. Of course, you can enter different values and see how it changes the premium price, shown on the right as "Theoretical price." We are going to use the Black-Scholes algorithm to get the theoretical price. The inputs you make on the left are for the algorithm. It's fairly easy to get the current price, and knowing what your option is tells you the strike price. For a 30 call, the strike price is 30. The most difficult input is typically the volatility (percentage per year). You can compute this for yourself with a spreadsheet (see the sidebar, "Steps for annualized historical volatility"). This is where it can get tricky, because the year you use can make a difference. Of course, with a little manipulation you can select a particular month you think is representative of a year and use that for volatility. The volatility you input is referred to as the historical volatility, because you are using past data. The other inputs, such as annual interest rate, are fairly easy, and I chose 1.2% for the guaranteed annual interest rate. Microsoft paid a modest dividend recently, but it is so small it doesn't make a lot of difference. At the bottom you input the expiration date. I looked for some valid LEAPS (long-term equity anticipation securities) options for Microsoft and chose "Jan 05." You can find the current bid/ask for all CBOE options contracts by going to the CBOE site, choosing "Market quotes," and then selecting "Delayed option quotes." Input the ticker symbol and choose the radial that says "List all options and LEAPS." You'll get a huge list for Microsoft. Scroll to find one that interests you.
OPTION ESTIMATIONSOnce you enter the expiration date (or you can enter the number of days to expiration), you get the theoretical premium price on the right, along with a bunch of Greek-looking stuff. If you use the Help function, you'll find an explanation of each of the Greek items, such as delta, which tells you how much the premium price changes with a change in underlying stock prices. You will also see the "Volatility" button, which allows you to use the current bid/ask premium price — say, the midpoint between bid and ask — input this current market price, and see the resulting volatility. This is called implied volatility, because it is driven by the market. Just clear the volatility field, click on the Volatility button, and input the market value. The volatility field will show a number: the implied volatility. Now comes the (possible) dilemma. If the market disagrees significantly with your calculation of historical volatility, you will have to ask yourself: "Is my crystal ball any better than the market's?" In any event, you now have a benchmark price of the option you currently own. You can get an idea of how much it will be worth in the future by changing price and other inputs.
Dennis Peterson may be reached at DPeterson@Traders.com.
Current and past articles from Working Money, The Investors' Magazine, can be found at Working-Money.com.
|
SIDEBAR: Steps For Annualized Historical Volatility The most common way to get the standard deviation of a security is with a spreadsheet. If you're not familiar with that process, here are basic instructions:
|
Market index trading on a daily basis.
| Title: | Staff Writer |
| Company: | Technical Analysis, Inc. |
| Address: | 4757 California Ave SW |
| Seattle, WA 98116-4499 | |
| Phone # for sales: | 206 938 0570 |
| Fax: | 206 938 1307 |
| Website: | working-money.com |
| E-mail address: | dpeterson@traders.com |
Traders' Resource Links | |
| Charting the Stock Market: The Wyckoff Method -- Books | |
| Working-Money.com -- Online Trading Services | |
| Traders.com Advantage -- Online Trading Services | |
| Technical Analysis of Stocks & Commodities -- Publications and Newsletters | |
| Working Money, at Working-Money.com -- Publications and Newsletters | |
| Traders.com Advantage -- Publications and Newsletters | |
| Professional Traders Starter Kit -- Software | |
PRINT THIS ARTICLE

Request Information From Our Sponsors
- StockCharts.com, Inc.
- Candle Patterns
- Candlestick Charting Explained
- Intermarket Technical Analysis
- John Murphy on Chart Analysis
- John Murphy's Chart Pattern Recognition
- John Murphy's Market Message
- MurphyExplainsMarketAnalysis-Intermarket Analysis
- MurphyExplainsMarketAnalysis-Visual Analysis
- StockCharts.com
- Technical Analysis of the Financial Markets
- The Visual Investor
- VectorVest, Inc.
- Executive Premier Workshop
- One-Day Options Course
- OptionsPro
- Retirement Income Workshop
- Sure-Fire Trading Systems (VectorVest, Inc.)
- Trading as a Business Workshop
- VectorVest 7 EOD
- VectorVest 7 RealTime/IntraDay
- VectorVest AutoTester
- VectorVest Educational Services
- VectorVest OnLine
- VectorVest Options Analyzer
- VectorVest ProGraphics v6.0
- VectorVest ProTrader 7
- VectorVest RealTime Derby Tool
- VectorVest Simulator
- VectorVest Variator
- VectorVest Watchdog