HOT TOPICS LIST
- Strategies
- Stocks
- Buy
- Investing
- Brokers
- Psychology
- Interviews
- Accumulate
- Sell
- Hold
- Spotlight
- Websites
- Candlestick Corner
- Gold & Metals
- Options Trading
LIST OF TOPICS
THE CHARTIST
Swing Trading With Trendlines
08/20/03 02:34:15 PM PSTby Phillip S. Duke, Ph.D
All trends, whatever they are, last only so long.
| Trend following is based on the concept that what has been occurring will most likely continue. The weather can be forecast with 70% accuracy by simply saying it will be the same tomorrow as it was today. But sooner or later the weather changes, at which point this simple forecasting method fails. Basically, a price trend refers to the price of a tradable moving in a given direction over time. As a result, price/direction and price/time considerations are the key factors to consider when analyzing trends. An old market saying goes, "Every price advance weakens the market, every price decline strengthens it." The price of anything is determined by how much buyers/sellers will buy/sell it for. Everything has its price — no more, no less. All price trends eventually end, and when they do, they frequently reverse, trapping unwary trend riders. The greater the percent price change and the longer it has existed, the less likely it is to continue.
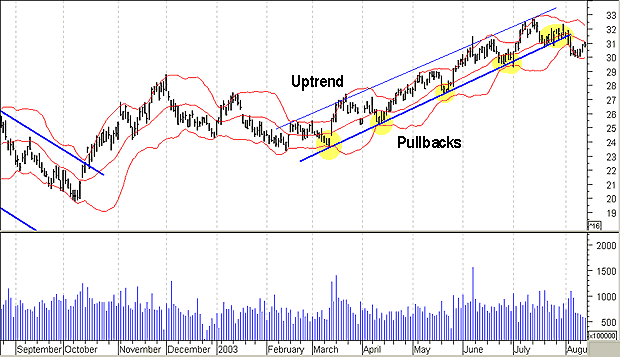
TRENDLINE ANALYSISPrices are constantly fluctuating to varying degrees during active trading. This makes it difficult to determine the overall price direction over time. Two methods are most commonly used to determine if there is a trend and its direction: trendline analysis (TLA) and moving averages. I will only discuss trendline analysis in this article, but usually, it's best to employ at least two methods and take action when their signals agree. Trendline analysis identifies price pullbacks, which are reactions to the direction of the main trend. An example of an uptrend can be seen in Figure 1; note the pullbacks forming at increasingly higher prices. When you are drawing a trendline in an uptrend, the lows of the pullbacks should be connected in a straight line. Most trading software provides trendline tools that will help you do this. Another option is to hand-draw them using a straightedge. Sometimes you may find that you can draw a line below and parallel to the trendline that connects the highs. The areas between the upper and lower lines are known as price channels, and as long as the overall trend does not change, prices will move within this channel. The price range is the vertical price difference between the two trendlines.
Figure 1: Uptrend. Trendline analysis identifies price pullbacks, which are small reactions in the reverse direction of the main trend. Here's an example of an uptrend.
Sometimes a trendline can be obtained with only a single pullback. If there are two pullbacks forming the lower trendline and only one forming the upper, you can draw a line parallel to the lower two but touching only the one pullback. This single pullback is not as reliable as two for defining a price channel, but it may work for you, nonetheless.
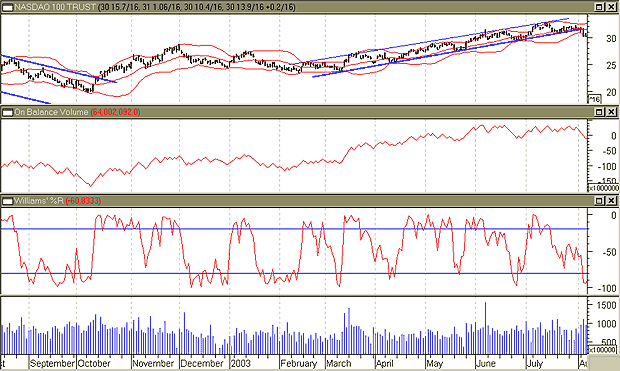
TRADING WITH THE TRENDThe basic idea, of course, is to trade with the trend. Everyone knows the old market saying "The trend is your friend," but this is true only so long as the trend continues in the direction you expect it to go. If it starts reversing, the trend is definitely not your friend. If, by connecting price pullbacks, it becomes evident that prices are coming close to parallel upper or lower trendlines, you may choose to take a long/short position. You should enter positions when prices are either touching or close to either the upper or lower line. Coming in this way allows entry close to the best possible price, and allows for a quick, convenient exit if the trendline fails. To take a position — for example, in an uptrend — wait for the trending prices to make a new, relatively high downside pullback (that is, higher than the last) when they descend to the lower trendline. As the trendline is approached, you may want to check other technical indicators to determine if the trend will continue. Some additional indicators you could use are Bollinger Bands, moving average convergence/divergence (MACD), trading volume, and Williams' %R (Figure 2). Are these indicators suggesting the trend will probably continue? If you are satisfied that the uptrend may continue, enter an order to buy 1% to 5% above the lower trendline to help fill your buy order. Other people can read trendlines too, and prices may turn without touching the trendline. If the Bollinger Band is close to and slightly above the trendline, you may want to buy at the band.
Figure 2: Williams' %R. Some additional indicators you could use are Bollinger Bands, moving average convergence/divergence (MACD), trading volume, and Williams' %R.
Once your order is filled, observe the price action. The trend may fail, there may be a false failure, or the trend may hold. If the two channel lines are not close to parallel (they should be within about 10 degrees), then you probably have a broadening or wedging price pattern channel, and prices in such pattern channels are much more prone to reversals than valid trend channels.
TRENDLINE FAILUREIn an uptrend, if the closing price at any time is at least about 3% below the upward sloping lower trendline (the exact percentage depends on the particular stock's volatility), it is possible the uptrend is over, and you have a trendline failure. Valid trendline failures are often accompanied by the Bollinger Band turning down, a negative MACD, increased volume, or a gap, all indicating more downside than upside trader sentiment. In such a case, either close out the long position or wait for an upside price pullback reaction and close it out. Sometimes, a downside trendline penetration is followed by an upside price pullback reaction that may go above the lower trendline from below and reverse before hitting the upper trendline, usually continuing down. Whenever an uptrend is terminated, prices generally decline enough so it is better not to stay with the position. The converse takes place during a downtrend. It is best to exit on a trendline penetration. If the trend resumes you can always get on board again, but if the trend has reversed you will be happy not to be a passenger. Keep in mind, however, that occasionally there are false trendline failures. Prices penetrate the trendline and then reverse, carrying back into the price channel (or pattern), and then move with the trend as before. These invalid or false trendline failures are among the most trying events in a trend trader's life. They are not common, but they do occur.
THE TRENDLINE HOLDSIf the closing price on the day you take the position is at or above the lower trendline, and the lower trendline is not violated by a close for the next few trading days, the trendline has held and the trend will probably continue. As prices work their way up, you should place day orders to take profits by selling about 3% below the upper trendline. Once you take your profit, wait for prices to approach the lower channel trendline and then attempt to repeat the process, keeping in mind that all price advances weaken the market. The end of an uptrend is usually signaled several ways. In one case, the most recent price uptrend is unable to go appreciably higher and occurs well below the upper trendline. In another, there may be a characteristic topping pattern, such as a multiple top or a gap down. Another method involves the lower trendline being decisively penetrated, usually with negative indicators on increased volume, and sometimes with a price gap.In yet another, moving averages turn down as the trend runs out of steam. Again, if the price advances do not carry to the upper trendline but stall anywhere near the last upside pullback, close out the position. The inability of prices to reach the uptrend upper channel line is a bearish signal.
SOME CATCHESThe major difficulty with trendline analysis is that trends change over time. Usually (but not always), a trend starts out slowly and weakly, gathering strength. As trader sentiment becomes more bullish, the price trend rises more steeply, and the channel changes. This can frustrate attempts to enter a long position. The downside pullbacks usually carry to the most recent trendline, but with more bearish sentiment they may carry to a previous, lower trendline, and turn there instead. There is more than one trend at all times. Unequal buying/selling pressures cause trends, due to trader sentiments. An uptrend exists due to sentiment being more bullish than bearish. Although one sentiment usually prevails at any one time, there are contrary sentiments in action at almost all times because trader sentiment is rarely unanimous. Since different sentiments result in somewhat different trends, there is in effect more than one trend working at any time, even over the same time frame. This is one reason why pullbacks do not line up evenly; uneven pullbacks are manifestations of differing trend sentiments. To optimize results, you should consider all pullbacks. The trend may fail at any time. A trend begins and continues due to prevailing bullish or bearish sentiment. Unexpected news may enter the market and reverse the trend, sometimes temporarily, sometimes permanently. The adages "Don't place all your eggs in one basket" and "Don't overtrade" are based on this. Diversification and limiting use of trading capital are helpful in case such an event occurs.
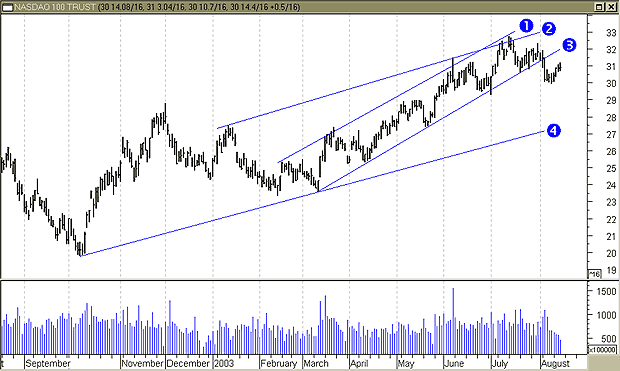
APPLYING TRENDLINESIn Figure 3, you see a recent six-month graph of the popular QQQ Nasdaq tracking index. I have drawn in and numbered major trendlines. Since early January 2003, QQQ prices have been in overall uptrends. Two major uptrends are evident. One is well defined with four lower and two upper pullbacks defining trendlines 1 and 3. It has a $3 range and began about 21 weeks ago.
Figure 3: QQQ Nasdaq index. Here's a recent six-month graph of the QQQ Nasdaq tracking index with major trendlines drawn in. Since early January 2003, QQQ prices have been in overall uptrends. Two major uptrends are evident. One is well defined with four lower and two upper pullbacks defining trendlines 1 and 3. It has a $3 range and began about 21 weeks ago.
Trend 2 is less well defined, with three upper pullbacks and a lower one defining trendlines 2 and 4. It has a $5 range and began about 26 weeks ago. Although the first trend is better defined, trend 2's greater magnitude in time and space make it the dominant trend. Trend 1 is an intermediate trend inside trend 2's longer trend. In late July, the price range penetrated trendline 3. This sign of temporary price weaknesses suggests the possibility of more important future price weakness. Upper trendlines 1 and 2 intersect around 32 early in mid-June. The intersection of two such upper up trendlines provides strong resistance to additional price increase. Perhaps it is a coincidence — or perhaps not — that on or close to intersection, the volume traded unusually high, over 150 million shares, and prices subsequently declined $2 or 6.4%. On July 7, 8, and 9, prices closed on upper trendline 2. On July 9 the daily price range penetrated upper trendline 2, but reversed, and on July 10 prices fell. It looks as if trendline 2 prevailed and acted as a resistance level. The upside range penetration of trendline 2 on July 9 is a sign of possible future price strength. Price movements between trendlines 2 and 3 are in an upward wedge pattern, which is bearish. As prices have already turned three times at this trendline, it is likely that prices will probably turn at it again. The upward wedge price pattern suggests that prices will decline from 2, possibly penetrating 3, then carry to at least 4. If the QQQ declines to trendline 4, it would still be in an uptrend. Trendline analysis (TLA) theory indicates if the price declines to trendline 4, it may be worth trying a long position there. How reliable is TLA? Like all other forms of technical analysis, it suffers from the fact that unexpected news can enter the market at any time, thereby invalidating the most accurate analysis. Technical analysis is based on what is in the market. Anything not in the market is not reflected in technical analysis. Changes in trend strength are always possible, and this makes the method less reliable. Constant vigilance is required to determine if the trend strength has changed. False trendline penetrations are always possible, but fortunately, they do not occur frequently. The possibility of a false penetration must be kept in mind. In addition, it is easy to draw the wrong number of trendlines, and so it is easy to mistake the results of trendline analysis. With practice and experience, this difficulty is minimized. But then, what is perfect in this world? Understanding the limitations of TLA is an essential part of its working for you. Though it has its strengths, based on my experience, trendline analysis is a generally but not always reliable valuable trading tool.
Phillip Duke may be reached at drpduke@wmconnect.com. SUGGESTED READING Farley, Alan S. [2001]. The Master Swing Trader. McGraw-Hill. Murphy, John J. [2000]. Charting Made Easy. Marketplace Books. MetaStock (Equis International)
Current and past articles from Working Money, The Investors' Magazine, can be found at Working-Money.com.
|
| E-mail address: | drpduke@wmconnect.com |
PRINT THIS ARTICLE

Request Information From Our Sponsors
- StockCharts.com, Inc.
- Candle Patterns
- Candlestick Charting Explained
- Intermarket Technical Analysis
- John Murphy on Chart Analysis
- John Murphy's Chart Pattern Recognition
- John Murphy's Market Message
- MurphyExplainsMarketAnalysis-Intermarket Analysis
- MurphyExplainsMarketAnalysis-Visual Analysis
- StockCharts.com
- Technical Analysis of the Financial Markets
- The Visual Investor
- VectorVest, Inc.
- Executive Premier Workshop
- One-Day Options Course
- OptionsPro
- Retirement Income Workshop
- Sure-Fire Trading Systems (VectorVest, Inc.)
- Trading as a Business Workshop
- VectorVest 7 EOD
- VectorVest 7 RealTime/IntraDay
- VectorVest AutoTester
- VectorVest Educational Services
- VectorVest OnLine
- VectorVest Options Analyzer
- VectorVest ProGraphics v6.0
- VectorVest ProTrader 7
- VectorVest RealTime Derby Tool
- VectorVest Simulator
- VectorVest Variator
- VectorVest Watchdog


