HOT TOPICS LIST
- Strategies
- Stocks
- Buy
- Investing
- Brokers
- Psychology
- Interviews
- Accumulate
- Sell
- Hold
- Spotlight
- Websites
- Candlestick Corner
- Gold & Metals
- Options Trading
LIST OF TOPICS
FOCUS ON
The Value Line Arithmetic Index
09/03/03 02:50:26 PM PSTby David Penn
What can the Value Line Arithmetic Index tell us about stocks?
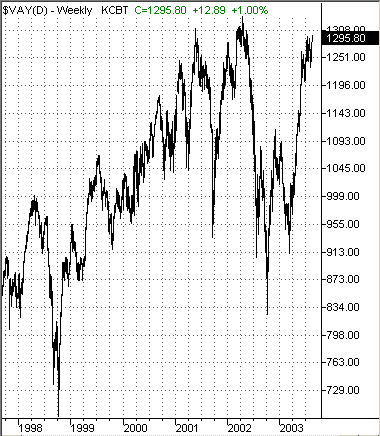
| What if I told you there was a good chance that stocks would reach new, all-time highs over the next few months? Would you call me crazy? Deluded? An unrepentant bull market booster? Well, unless you were looking at the Value Line Arithmetic Index ($VAY), you would probably have good reason to call me all those things and more. But the fact of the matter is that Value Line Arithmetic Index, an index of the "average" Value Line stock, followed up its peak in early 2001 with an even higher peak in late 2001. And while 2002 was a brutal market for stocks across the board and for the Value Line Arithmetic in particular, the rebound from those lows looks poised to send the $VAY on a ride to as high as 1400 before the end of this year. The $VAY has been on a long, strange trip ever since the major stock market averages — the Dow Jones Industrial Average (DJIA) and the Standard & Poor's 500 — topped out in spring 2000. The $VAY peaked at 1311 in May 2001, fully a year after the S&P 500 began moving down (the S&P 500 had fallen from 1527 to 1278, a decline of 16%, by the time the $VAY made its 2001 peak). The correction from this peak was short, but sharp, as the $VAY lost some 28% before bottoming in late September 2001 at approximately 935. The $VAY rallied strongly from these lows, much like the broader stock indexes. However, unlike the DJIA or the S&P 500, the Value Line Arithmetic Index's rally actually managed to set a new all-time high of 1338 by mid-April 2002.
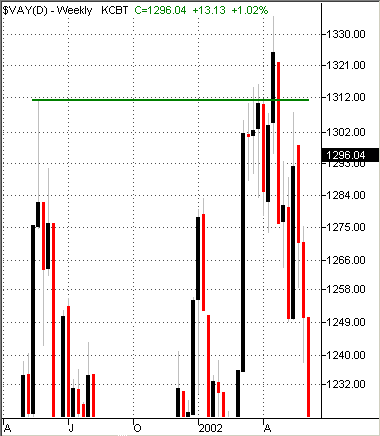
Figure 1: While the S&P 500 and Dow industrials were struggling to bounce back, 2002 saw the Value Line Arithmetic Index make new, all-time highs. On the positive side, the new high — while only marginally higher than the previous peak in May 2001 — seemed to suggest there might be a great deal more strength in certain stocks than the more commonly referred to indexes and averages were revealing. On the negative side, however, the inability of the Value Line Arithmetic Index to follow through to the upside after setting the new high in the spring of 2002 set up a classic, 2B test of top. And when the $VAY top test proved to be successful, the index sank: hard and fast. By early October, the $VAY had lost more than 500 points, falling by more than 38% before bottoming around 825.
Figure 2: Failure to follow through on the higher weekly close in April 2002 (higher vis-à-vis the previous peak in March 2001) was a signal that the Value Line's rally from the September 11th lows was over after a gain of more than 40%.
ARITHMETIC VS. GEOMETRICWhat exactly is the Value Line Arithmetic Index, and how does it differ from the Value Line Geometric Index? Both indexes are products of Value Line Inc., developers of the popular Value Line Investment Survey. The two indexes both consist of the approximately 1,700, equally weighted stocks that make up the investment survey. The principal difference between the two indexes, however, is the way that they are calculated. The Arithmetic Index consists of a simple mean or average in which the sum of the items is divided by the number of items. The Geometric Index, on the other hand, is a bit more complex. According to Value Line's description at www.valueline.com, the geometric average involves taking the nth root of the product of n items. If n = 4, then the geometric average of the four items would be the fourth root of the product of the four items — in other words, multiply the four items together and take the fourth root of that product. What difference do these computation methods make on the respective indexes? Generally speaking, both Value Line indexes do a better job than the S&P 500 and Dow Industrials do at picking up the price action of smaller stocks. Because both averages are equally weighted, as Value Line senior vice president and director of research Samuel Eisenstadt told Working Money in an interview back in October 2000, "GE doesn't get any more weight than a small electronics manufacturer." Such a distinction, Eisenstadt continued, helped investors notice the strength of small and mid-cap stocks in 2000, as the more common market averages seemed to be anticipating little more than continued weakness across the board. One of the more particular aspects of the Arithmetic Index is that, based on the way the index is put together, it tends to advance farther than the Geometric Index in a bull market and decline less in a bear market. This has led some to claim a preference for the Geometric Index, which is believed by its adherents to be a truer reflection of stock strength than its Arithmetic alternative. One such "Arithmetic" critic, Peter Eliades of Stockmarket Cycles, quipped early this year that "the Value Line Arithmetic Index . . . reached a new, all-time high in April 2002. Show us anyone's diversified portfolio that went to new all-time highs in April 2002. The Arithmetic has a very distorted upside bias." Nevertheless, as Eliades points out, even this bias has its uses, particularly in revealing (per his analysis) the level of overvaluation in equities, generally speaking.
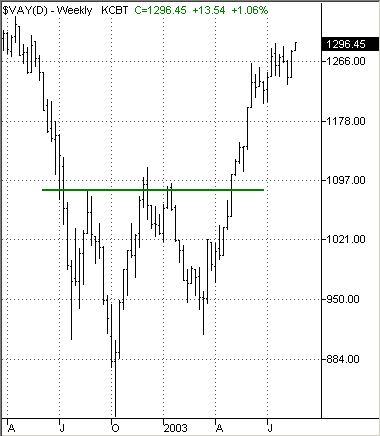
TOWARD A NEW ALL-TIME HIGH?Where is the Value Line Arithmetic now, as the S&P 500, Dow industrials, and Nasdaq appear mired in trading ranges? Like these other stock market averages, the Value Line Arithmetic traced out a triple bottom/head and shoulders bottom between its July 2002 and March 2003 lows. However, because the $VAY never suffered the extreme losses experienced by the other indexes, the upside from its triple bottom/head and shoulders bottom actually appears to be yet another all-time high. A simple measurement based on Stan Weinstein's swing rule allows us to subtract the value at the bottom of the formation from the value at the top, and then to add that amount to the value at the top of the formation. This accomplished, we get an upside projection of about 1400 — some 60-odd points higher than the previous $VAY peak in April 2002.
Figure 3: The upside projection from this head and shoulders bottom in the Value Line Arithmetic Index points to a new, all-time high.
While the Arithmetic Index may not represent the average diversified stock portfolio as Eliades suggests, it serves to remind us that while the big-money averages like the S&P 500 and the Dow industrials are what most retail investors follow, there is more to stock movement than what is represented in these averages. The Value Line Arithmetic Index is a reminder that even as the major averages are mired in trading ranges, a good many stocks are likely breaking out to new 52-week and all-time highs. Note in Figure 3 the consolidation in August. While the August consolidations in the S&P 500 and the Dow industrials remain to be resolved, the Value Line Arithmetic Index already appears to have resolved its consolidation by moving up to challenge the July high just above 1295. Already within 43 points of its all-time high, it seems likely that the Value Line Arithmetic Index will take out the previous high at 1338 before its current rally is done — which should create bullish portents for the other stock market averages. Technical analyst and trader Richard Rhodes once spelled out his principal "Rules for Trading." The first rule he states is one that has some relevance here:
"The first and most important rule is — in bull markets, one is supposed to be long. This may sound obvious, but how many of us have sold the first rally in every bull market, saying that the market has moved too far, too fast. I have before, and I suspect I'll do it again at some point in the future. Thus, we've not enjoyed the profits that should have accrued to us for our initial bullish outlook, but have actually lost money while being short. In a bull market, one can only be long or on the sidelines. Remember, not having a position is a position."
Whether the Value Line Arithmetic Index moves too far up or not enough down in bull and bear markets compared to other indexes is only partially the point. The Arithmetic Index's continued movement upward suggests more than the reality that there are a number of stocks that are continuing to do well since the intermediate bull market began in March 2003 (and some so well that new, all-time highs are appearing in many stocks). The $VAY also underscores Rhodes' rule that a bull market is a bull market until it is not — even if some of the measures of that bull market appear relatively indecisive (the narrowly focused Dow industrials, for example). This means that the climate for buying stocks remains brighter than darker and that many of the basic rules of bull markets such as buying dips and avoiding short positions (especially over weekends) are almost as applicable now as they were back in April 2003 — or April 1999, for that matter. At the same time, watching the Value Line Arithmetic Index as it advances toward all-time highs will provide investors, traders, and market timers with yet another tool for determining just when this bull market/oversold bounce/bear market rally/stock reflation campaign has finally and truly run its course.
David Penn may be reached at DPenn@Traders.com.
Suggested readingEliades, Peter [2003]. "Stockmarket Cycles Update," January 13, Stockmarketcycles.com.Penn, David [2001]. "Interview With Samuel Eisenstadt Of Value Line," Working Money: January/February. Rhodes, Richard [2001]. "Trading Rules," http://www.therhodesreport.com. Charts courtesy of TradeStation
Current and past articles from Working Money, The Investors' Magazine, can be found at Working-Money.com. |
Technical Writer for Technical Analysis of STOCKS & COMMODITIES magazine, Working-Money.com, and Traders.com Advantage.
| Title: | Traders.com Technical Writer |
| Company: | Technical Analysis, Inc. |
| Address: | 4757 California Avenue SW |
| Seattle, WA 98116 | |
| Phone # for sales: | 206 938 0570 |
| Fax: | 206 938 1307 |
| Website: | www.traders.com |
| E-mail address: | DPenn@traders.com |
Traders' Resource Links | |
| Charting the Stock Market: The Wyckoff Method -- Books | |
| Working-Money.com -- Online Trading Services | |
| Traders.com Advantage -- Online Trading Services | |
| Technical Analysis of Stocks & Commodities -- Publications and Newsletters | |
| Working Money, at Working-Money.com -- Publications and Newsletters | |
| Traders.com Advantage -- Publications and Newsletters | |
| Professional Traders Starter Kit -- Software | |
PRINT THIS ARTICLE

|

Request Information From Our Sponsors
- VectorVest, Inc.
- Executive Premier Workshop
- One-Day Options Course
- OptionsPro
- Retirement Income Workshop
- Sure-Fire Trading Systems (VectorVest, Inc.)
- Trading as a Business Workshop
- VectorVest 7 EOD
- VectorVest 7 RealTime/IntraDay
- VectorVest AutoTester
- VectorVest Educational Services
- VectorVest OnLine
- VectorVest Options Analyzer
- VectorVest ProGraphics v6.0
- VectorVest ProTrader 7
- VectorVest RealTime Derby Tool
- VectorVest Simulator
- VectorVest Variator
- VectorVest Watchdog
- StockCharts.com, Inc.
- Candle Patterns
- Candlestick Charting Explained
- Intermarket Technical Analysis
- John Murphy on Chart Analysis
- John Murphy's Chart Pattern Recognition
- John Murphy's Market Message
- MurphyExplainsMarketAnalysis-Intermarket Analysis
- MurphyExplainsMarketAnalysis-Visual Analysis
- StockCharts.com
- Technical Analysis of the Financial Markets
- The Visual Investor


