HOT TOPICS LIST
- Strategies
- Stocks
- Buy
- Investing
- Brokers
- Psychology
- Interviews
- Accumulate
- Sell
- Hold
- Spotlight
- Websites
- Candlestick Corner
- Gold & Metals
- Options Trading
LIST OF TOPICS
TRADER'S NOTEBOOK
Those Essentials Of Technical Analysis
10/08/03 02:40:58 PM PSTby Larry Swing
Technical analysis doesn't have to be complex. Here's a reminder to keep it simple.
| We have a hard time making fast decisions with overwhelming, complicated information. As a result, we try to simplify trading as much as possible in order to scan for trading opportunities quickly. As Albert Einstein used to say, "Keep things as simple as possible, but not any simpler." The best way to do that is to keep the basics of technical analysis in mind.
THE BASICSA stock price is determined by an exchange between buyers and sellers. If there are more buyers than sellers, then the market goes up. If there are more sellers than buyers, then the market goes down. The price at which a stock is offered affects the trader's decision. If a trader is long and the stock starts to decline, the trader could be forced to close his position. If short, he might do likewise on a rising stock. When a trader takes a long position, he becomes a potential seller, while short positions are held by potential buyers. As prices change due to buying and selling pressure, information about the condition of the stock is revealed by the combination of price and volume action. To get this information, I use the following technical analysis tools as part of my daily charting arsenal:
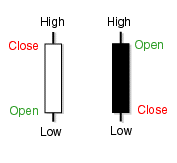
CANDLESTICKSIn the 1600s, the Japanese developed a method of technical analysis to analyze the price of rice contracts. This technique is known as candlestick charting. Steve Nison is credited with popularizing candlestick charting in the West and is now recognized as the leading expert on the modern interpretation. Candlestick charts display the open, high, low, and closing prices in a format similar to a modern-day bar chart, but in a manner that extenuates the relationship between the opening and closing prices. Candlestick charts are simply a different way of looking at price movements (Figure 1).
Figure 1: Open and closed candlestick charts. VOLUME
Volume is simply the number of shares traded during a given time frame — hour, day, week, or month. The analysis of volume is a basic yet important component of technical analysis. Volume provides clues about the intensity of a given price move. High volume levels are characteristic of market tops when there is a strong consensus that prices will move higher. High volume levels are also very common at the beginning of new trends (when prices break out of a trading range). In addition, just before market bottoms, volume will often increase due to panic-driven selling. Volume can help determine the strength of an existing trend. A strong uptrend should have higher volume on the upward legs of the trend, and lower volume on the downward (corrective) legs. Similarly, strong downtrend usually have higher volume on the downward legs of the trend and lower volume on the upward (corrective) legs (Figure 2).
VOLUME
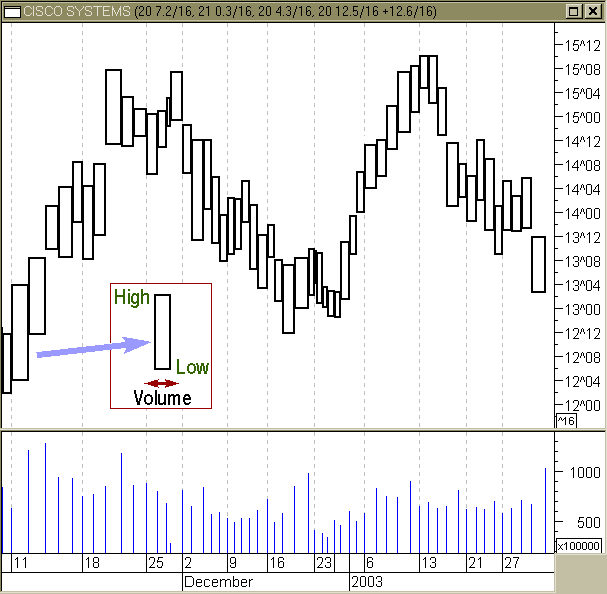
EQUIVOLUMEEquivolume displays prices in a manner that emphasizes the relationship between price and volume. Equivolume was developed by Richard W. Arms Jr. and is explained in greater detail in his Volume Cycles In The Stock Market. Instead of displaying volume as an afterthought on the lower margin of a chart, equivolume combines price and volume in a two-dimensional box. The top line of the box is the high for the period and the bottom line is the low for the period. The width of the box is the unique feature of equivolume. It represents the volume for the period (Figure 3).
Figure 3: Equivolume chart. Note the relationship between prices and volume. The shape of each equivolume box provides a picture of the supply and demand for the security during a specific trading period. Short and wide boxes (heavy volume accompanied with small changes in price) tend to occur at turning points, while tall and narrow boxes (light volume accompanied with large changes in price) are more likely to occur in established trends. Especially important are boxes that penetrate support or resistance levels, since volume confirms penetrations. A "power box" is one in which both height and width increase substantially, and they provide excellent confirmation of a breakout. Due to light volume, a narrow box casts doubt on the valley of the breakout in question.
MOVING AVERAGES
A moving average (MA) is an indicator that shows the average value of a security's price over a period of time. When calculating a moving average, a mathematical analysis of the security's average value over a predetermined time period is made. As the security's price changes, its average price moves up or down:
Simple MA = (P1 + P2 + . . . + Pn)/n
Where P is the price being averaged and n is the number of days in the MA. There are five popular types of moving averages: simple (also referred to as arithmetic), exponential, triangular, variable, and weighted. Moving averages can be calculated on any data series, including a security's open, high, low, close, volume, or another indicator. I use only the 10-, 20-, and 50-day simple MA on closing prices. Moving averages are usually used to determine if prices are in an uptrend or downtrend (Figure 4).
TRENDS
FORCE INDEXThe force index is an oscillator developed by Alexander Elder in his excellent Trading For A Living. The force index combines the three most essential pieces of market information:
It provides a new, practical way of using volume to make trading decisions (Figure 5):
Force Index = Volume (today) (Close(today) - Close(yesterday))
FORCE INDEX Although force index can be used raw, I prefer to smooth them with moving averages:
Force MA = FI - 3-day MA and FI - 13-day MA
A three-day moving average of the force index is a very sensitive indicator that shows the short-term battle between the bulls and bears. The 13-day MA of the force index identifies the longer-term battle between bulls and bears.
DIRECTIONAL MOVEMENT INDEXThe directional movement index (DMI) is a trend-following indicator developed by J. Welles Wilder Jr., designed to determine whether a security is in a trending or nontrending market. Since the market is in a strong trend only about 30% of the time and is sideways about 70% of the time, this indicator is used to capture the period when the market shows significant trending or directional behavior (Figure 6).
DIRECTIONAL MOVEMENT INDEX
The calculation of the DMI is fairly complex and consists of three lines: +DI: Current positive directional index, the range of highs divided by the price range over the last day and previous close, smoothed over a given number of periods.
-DI: Current negative directional index, the range of lows divided by the price range over the last day and previous close, smoothed over a given number of periods.
ADX: Modified moving average of the difference of +DI and -DI divided by the sum of +DI and -DI, multiplied by 100.
Larry Swing may be reached via www.mrswing.com.
SUGGESTED READINGArms, Richard W., Jr. [1989]. The Arms Index: An Introduction To The Volume Analysis Of Stock And Bond Markets, Dow Jones-Irwin. _____ [1994]. Volume Cycles In The Stock Market, Equis International. Elder, Alexander [1993]. Trading for a Living, John Wiley & Sons. Nison, Steve [1991]. Japanese Candlestick Charting Techniques, New York Institute of Finance/Simon & Schuster.
Current and past articles from Working Money, The Investors' Magazine, can be found at Working-Money.com. |
Larry Swing is the president of the day- and swing trading site www.mrswing.com, where free daily articles and videos on education, market analysis, and picks from Swing and other well-known traders can be found.
| Website: | www.mrswing.com |
PRINT THIS ARTICLE

Request Information From Our Sponsors
- VectorVest, Inc.
- Executive Premier Workshop
- One-Day Options Course
- OptionsPro
- Retirement Income Workshop
- Sure-Fire Trading Systems (VectorVest, Inc.)
- Trading as a Business Workshop
- VectorVest 7 EOD
- VectorVest 7 RealTime/IntraDay
- VectorVest AutoTester
- VectorVest Educational Services
- VectorVest OnLine
- VectorVest Options Analyzer
- VectorVest ProGraphics v6.0
- VectorVest ProTrader 7
- VectorVest RealTime Derby Tool
- VectorVest Simulator
- VectorVest Variator
- VectorVest Watchdog
- StockCharts.com, Inc.
- Candle Patterns
- Candlestick Charting Explained
- Intermarket Technical Analysis
- John Murphy on Chart Analysis
- John Murphy's Chart Pattern Recognition
- John Murphy's Market Message
- MurphyExplainsMarketAnalysis-Intermarket Analysis
- MurphyExplainsMarketAnalysis-Visual Analysis
- StockCharts.com
- Technical Analysis of the Financial Markets
- The Visual Investor


