HOT TOPICS LIST
- Strategies
- Stocks
- Buy
- Investing
- Brokers
- Psychology
- Interviews
- Accumulate
- Sell
- Hold
- Spotlight
- Websites
- Candlestick Corner
- Gold & Metals
- Options Trading
LIST OF TOPICS
TRADER'S NOTEBOOK
Pivot Levels And The Power Of Commonality
10/15/03 04:41:45 PM PSTby Christopher Terry
Understanding how to use pivot levels will help you determine when to enter or exit a trade.
| Pivot levels can be used to identify turning points in a trend so you can decide when to enter and exit a trade. Reading this article should help you better understand pivot levels and provide the tools you need to determine your entry and exit prices. In addition, in this article we'll be looking at weekly and monthly support and resistance levels. Most important, we'll be looking at how to use multiple time frames to determine common levels where two or more time frames find the same price ranges.
Calculations for pivot levelsResistance 2: R-2 = Main Pivot + (High - Low) Resistance 1: R-1 = (Main Pivot x 2) - Low Main Pivot: P = (High + Low + Close) / 3 Support 1: S-1 = (Main Pivot x 2) - High Support 2: S-1 = (Main Pivot) - (Resistance 1 - Support 1)
The simplest way to understand these pivot levels is to treat them as if they were a Fibonacci retracement level or a moving average. Basically, you want to buy at support and short at resistance. Once support is broken, it becomes resistance, and once resistance is broken, it becomes support. Like moving averages, there are plenty of variables from which to choose. For example, some traders use two- or three-day ranges to determine their own pivots. Other traders may use a continuous tally of the prior five-day range, where each day may have new pivot levels. Starting off with a basic structure of daily, weekly, and monthly levels is the easiest. Each bar on daily, weekly, and monthly charts holds sufficient data to plot out pivot levels for the following day, week, or month. The term pivot level will be used when referring to pivot support and resistance levels. For a specific reference, P will mean "main pivot," S-1 will mean "support level 1," S-2 will mean "support level 2," R-1 will mean "resistance level 1," and R-2 will mean "resistance level 2." Pivot levels are calculations based upon the data of the prior price bar's high, low, and close to determine P. Sometimes a third support, S-3, or third resistance level, R-3, is used in an extreme trending market. Daily pivot levels are calculated using the previous day's high, low, and close. These levels are used for the following trading day, helping us determine the short-term trend. The plots for these daily pivot levels are shown on a five-minute chart. For example, the high, low, and close for Monday will determine the daily pivot levels for Tuesday. Weekly pivot levels are calculated using the previous week's high, low, and close. These levels are used for the following week of trading to determine the intermediate-term trend. The plots for these weekly pivot levels are shown on a daily chart. For example, last week's high, low, and close from Monday to Friday will determine weekly pivot levels for this coming Monday at open of trading to the Friday close of trading. Monthly pivot levels are calculated using the high, low, and close of the previous calendar month. These levels are used for the following month of trading to determine the long-term trend. The plots for these monthly pivot levels are shown on a daily chart. For example, the high, low, and close for June will determine the monthly pivot levels from the open of the first day to the close of the last day of trading in July. Floor traders have used pivot levels for years, long before real-time charting programs were common. After calculating their daily pivot levels, floor traders use various levels of support and resistance they make note of. They use these levels to help them buy or sell the market that they are trading for that day. These daily pivot levels are still widely used by floor traders as well as short-term traders.
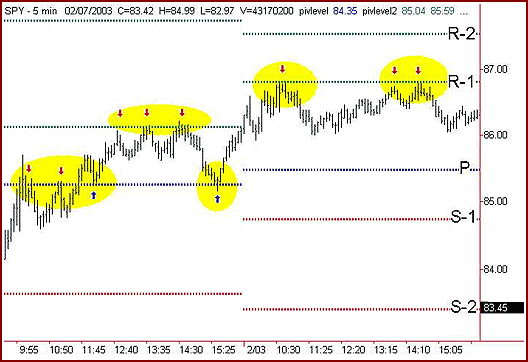
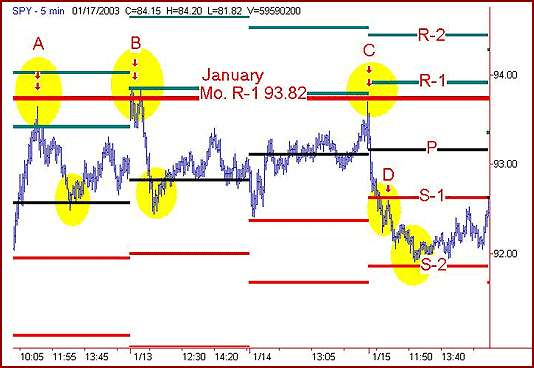
SHORT-TERM TREND: DAILY PIVOTSTypically, in a nontrending market, support and resistance levels are very important to short-term countertrend trading. In Figure 1, a short-term trader would be able to spot eight chances to sell and two chances to buy using P and R-1. On February 2, 2003, P acts as a resistance level at 10:05 am and 11:05 am. When the Standard & Poor's 500 tracking stock (SPY) traded above this level, P acted as a support level. SPY then rallied to the R-1 level, which acted as a resistance level. In a trending market environment, the rules change, so countertrend trading will not have high odds of success.
FIGURE 1: Pivot levels in nontrending markets
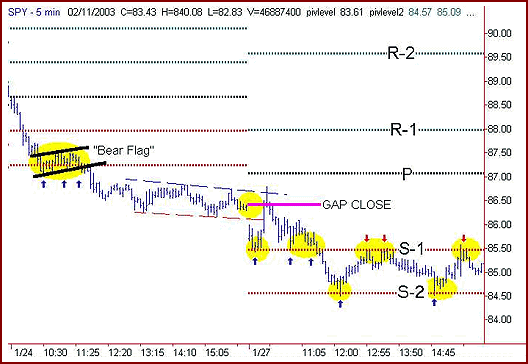
In Figure 2, a bear flag pattern at S-2 highlighted additional weakness. This pattern suggests continued weakness in the market. One good short pattern for the entire day was all that was needed for a successful trading day. Once S-2 failed to hold as a key support, the market continued lower into the close, forming a descending channel. It was not until the following day that the immediate-term support was found at S-1. After breaking S-1, prices tested S-2, and until the close, S-1 acted as resistance and S-2 acted as support.
FIGURE 2: Using calculated pivots, support, and resistance in a trending environment
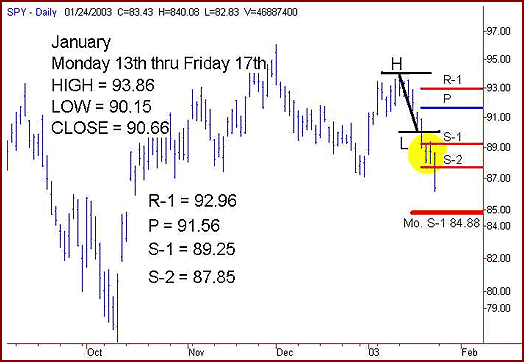
INTERMEDIATE-TERM PIVOTSSo far, I have given an overview of pivot levels showing different scenarios in trending and nontrending markets. In Figure 3, the weekly pivot levels act as intermediate-term support and resistance. You can see that SPY consolidated between 87.85 (S-2) to 89.25 (S-1) for two days. It then broke down the following day and the trend continued lower, as can be seen in the five-minute chart in Figure 2.
FIGURE 3: Applying weekly pivot levels to identify intermediate-term trend support and resistance
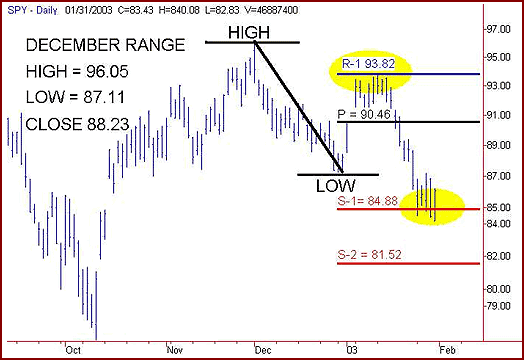
LONG-TERM PIVOTSIn Figure 4, you can see that SPY traded below R-1 from January 6, 2003, to January 16, 2003, with a high of 93.86. After failing at R-1, the market turned lower and traded down to P. It consolidated for that day.
FIGURE 4: Applying monthly pivot levels
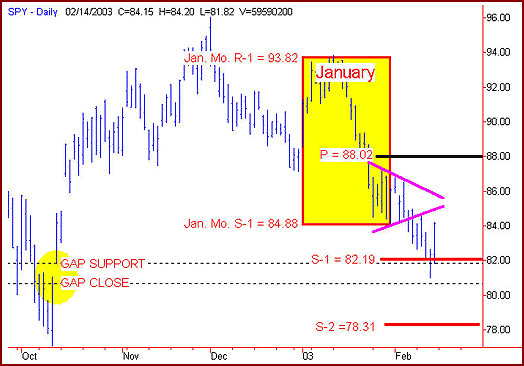
This was a key support until the next day, where the SPY broke down below the P level. Note how on Figure 2 you see the daily support levels around the 84.50 to 85.50 range. Look at how both the monthly and daily support levels helped support the market from having further price decline. The monthly levels help determine the support and resistance levels of the bigger picture. They also help identify key turning points in the market. Figure 5 shows R-1 and S-1 for January. After SPY turned down from a test of the January R-1, SPY trended down where it held above the January S-1. This level served as a key support until the end of January S-1. This level served as a key support until the end of January. Consolidation then occurred, where a triangle pattern was formed.
FIGURE 5: R-1 and S-1 levels for January
February had new pivot levels calculated from the January range. The S-1 level had a common support with a gap area. On February 13, 2003, SPY tested through S-1 as well as the gap support. Once it tested near the gap close, it reversed sharply and closed above S-1 on an intraday time frame. The following day, SPY tested toward the gap support before reversing and trading above S-1. This led to a 2.38-point rally off the lows for that trading day. Monthly pivots can keep you on the correct side of the market. Had the price failed to close above S-1, it would have alerted you to pay attention for a possible leg lower toward the S-2 pivot level. Now, if you go back to Figure 3, you see prices consolidating between the weekly supports of S-1 and S-2 and interrupting the progress of the monthly trend. After a breakdown of the weekly pivot level, S-2, at 87.85, a monthly downtrend is confirmed. A forecast of a test of the monthly pivot level S-1 of 84.88 is expected. the power of commonality Commonality levels are the most important and powerful of all individual support or resistance levels. By combining multiple ideas and multiple time frames of similar concepts pivot levels, Fibonacci retracement levels, or gaps the more confirming a market turning point. A simple example would be using the daily R-1 and monthly R-1 to find common ground for a resistance level, as seen in Figure 6. The individual stock or index determines what a common area will be. These commonality levels can be combined with a chart pattern to help improve your analysis (Figure 6).
FIGURE 6: Commonality levels between the monthly R-1
A market will not always find exact support or resistance when using a larger time frame weekly or monthly chart. A trader must allow room for noise, and for testing above or below weekly and monthly levels. The basic rule is that if two or more levels of support or resistance share the same common area, it is considered a "commonality level." In a similar fashion, if two or more concepts share the same support or resistance zone, it is also a commonality. Think in terms of "zones" when using these concepts on a higher time frame. By using pivot levels, you can see areas of support and resistance not apparent on the chart itself. Because pivot levels are not actually a gap or an important high or low on the chart, some traders do not agree with their use. Remember, pivot levels were used for years by floor traders long before trading software became prevalent. Some charting platforms include intraday levels as a part of the software. By taking the time to identify points that will allow you to see a much clearer picture of a significant support or resistance, you could have some added confidence in entering or exiting trades around those levels. If you use daily pivot levels, you may find the addition of weekly, monthly, and other patterns beneficial. By themselves, pivot levels are not intended as a stand-alone trading idea. Traders who use these pivot levels should always have confirmation on their charts before entering or exiting trades.
Suggested readingErman, William T. [1999]. "Compound Pivots And Market Symmetry," Technical Analysis of Stocks & Commodities, Volume 17: April.Gopalakrishnan, Jayanthi [2000]. "Pivot Points," Technical Analysis of Stocks & Commodities, Volume 18: February. Peterson, Dennis D. [2002]. "What Are Pivots?" Working-Money.com, Technical Analysis of Stocks & Commodities, Volume 20: April.
Current and past articles from Working Money, The Investors' Magazine, can be found at Working-Money.com. |
Christopher Terry is a full-time stock and index futures trader. He has spoken at a number of conferences and written articles for various magazines. In addition to his trading, Terry and his partner, Linda Bradford Raschke, provide a wealth of free educational information for both stock and futures traders at www.LBRgroup.com.
| Website: | www.LBRgroup.com |
PRINT THIS ARTICLE

Request Information From Our Sponsors
- VectorVest, Inc.
- Executive Premier Workshop
- One-Day Options Course
- OptionsPro
- Retirement Income Workshop
- Sure-Fire Trading Systems (VectorVest, Inc.)
- Trading as a Business Workshop
- VectorVest 7 EOD
- VectorVest 7 RealTime/IntraDay
- VectorVest AutoTester
- VectorVest Educational Services
- VectorVest OnLine
- VectorVest Options Analyzer
- VectorVest ProGraphics v6.0
- VectorVest ProTrader 7
- VectorVest RealTime Derby Tool
- VectorVest Simulator
- VectorVest Variator
- VectorVest Watchdog
- StockCharts.com, Inc.
- Candle Patterns
- Candlestick Charting Explained
- Intermarket Technical Analysis
- John Murphy on Chart Analysis
- John Murphy's Chart Pattern Recognition
- John Murphy's Market Message
- MurphyExplainsMarketAnalysis-Intermarket Analysis
- MurphyExplainsMarketAnalysis-Visual Analysis
- StockCharts.com
- Technical Analysis of the Financial Markets
- The Visual Investor

