HOT TOPICS LIST
- Strategies
- Stocks
- Buy
- Investing
- Brokers
- Psychology
- Interviews
- Accumulate
- Sell
- Hold
- Spotlight
- Websites
- Candlestick Corner
- Gold & Metals
- Options Trading
LIST OF TOPICS
TRADER'S NOTEBOOK
The Four-Month Rule
10/21/03 03:05:49 PM PSTby Matt Blackman
What is good for General Motors (GM) is good for America, or so the old saying goes. There is even an indicator that uses GM as an early warning of market changes. Here's a look at the "Big Three" US automakers and what they could be trying to tell us about the industry, the market, and the economy.
| As the largest automobile company in the world and America's biggest industrial enterprise, there is little doubt that what is good for General Motors (GM) is good for America. Using that logic, as the world's largest economy, what is good for the United States is also good for the world. Automobiles account for more than 5% of the US gross domestic product (GDP), and GM is the largest producer in the country. In 1998 the company employed more than 600,000 and racked up $166 billion in sales. What happens to GM has a significant effect on the equities markets, so it's not surprising that an indicator based on the price of its stock has been developed that is used to warn of market changes. In his book Technical Analysis Explained, Martin Pring discusses something called the four-month rule. In a nutshell, it describes how the price of GM stock can be used to gauge market strength:
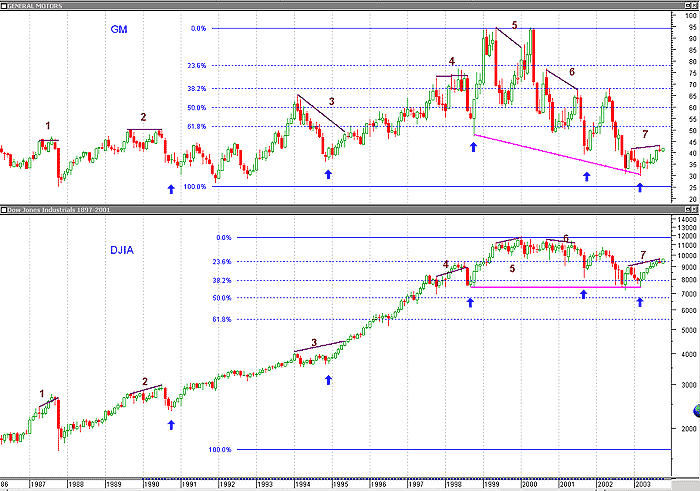
If in a bull market GM fails to make a new high within four calendar months of its previous peak (although some analysts prefer a 19- to 21-week rule), the bullish trend of the market has reversed or is just about to do so. . . Similarly, during a market decline, if GM fails to make a new low within four months of its previous trough, a reversal in the downtrend of the market has already taken place or is just about to occur. The hypothesis states that as a proxy, GM tends to rise and fall with large-cap indexes. At market tops, the stock generally leads the downturn, so that a new high set by the Dow Jones Industrial Average (DJIA) or Standard & Poor's 500 index that is unconfirmed by a new GM high is suspect. Unfortunately, according to Pring, the stock is not quite so reliable at market bottoms because it often lags in a recovery (see Figure 1).
Figure 1: Monthly charts of General Motors (GM) and the Dow Jones Industrial Average (DJIA) with Fibonacci retracements shown from the 1987 lows to September 2003. Points 1, 2, 4, 5, 6 and 7 all show negative divergence between GM and the DJIA. In each case, with the possible exception of 7, the warning was valid. Point 3 demonstrates the lag in a recovery by GM. Of greater concern is the negative divergence between GM and the DJIA from 1998 lows to October and March 2003 lows (see magenta lines). Pring ends this discussion by saying that "the GM rule is not infallible, but its record is extremely good." Like any indicator, it has value for the trader who knows how to use it. If GM price works well as a four- to five-month indicator, should it not also be reliable over longer periods?
TRADERS ONE, INVESTORS ZEROGM has not been a good investment for long-term shareholders in the last two decades. If you bought the stock after January 1990 and sold it recently, you lost money. In fact, since 1984, it has traded at $40 on more than 15 different occasions, the most recent of which was late September 2003. While this has been unfortunate for investors, traders who used the price of GM stock as an indicator did much better. GM stock prices warned of the pending drop in October 1987. They did so again in 1990, 1992, 1998, and 1999. With uncanny accuracy, each time the stock diverged from the DJIA, a market correction occurred. GM, Ford, and Daimler-Chrysler have been losing market share, which explains their poor stock performance of late. In 1996, the Big Three accounted for 72.5% of US automobile and light truck sales. That percentage shrank to 63.9% in 2003 in spite of all the zero-interest loan incentives in the last two years. GM's share of retail car and truck sales dropped from just over 30% in 1996 to around 26% in 2003. GM stock is giving a warning again. First, it is failing to confirm that we are in a recovery by putting in a new high within four to five months of a bottom. Second, it is showing negative divergence with the DJIA in a number of time frames.
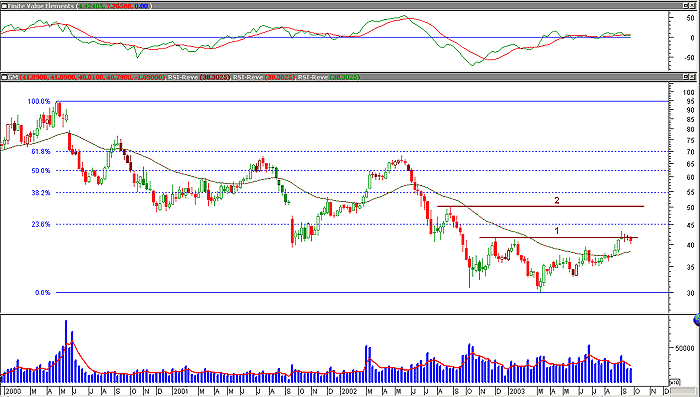
TAKING STOCK: RECOVERY OR RELIEF RALLY?To properly decipher the most recent signals, it is important to determine where we are now, since we know that the indicator works better at market tops than bottoms. Are we still locked in a secular bear market, or is this truly a bottom and the start of a new bull? Bulls would argue that since the DJIA put in a low in October and that there has been a series of higher lows and higher highs, a recovery is under way. Although GM did not confirm we are in a recovery (it failed to put in a new high in the four to five months following the bottom), this can be ignored since it has a habit of lagging in market recoveries (see Figure 2).
Figure 2: Weekly chart of General Motors (GM) with the finite value elements indicator in the upper window, which works quite well as an early market direction indicator. For those who claim that the bull market began in October, GM has yet to reach a new high (line 2). For those who say the bull began in early March 2003, the four-month rule test still fails, as it took until the first week of September for GM to hit a new high (line 1).
But bears argue we are simply experiencing another short-lived rally, the eighth since the market peaked in 2000. They see the latest negative divergence with the DJIA (Figure 1, point 7) as a warning of another upcoming market downturn. Here are two more points in support of this premise:
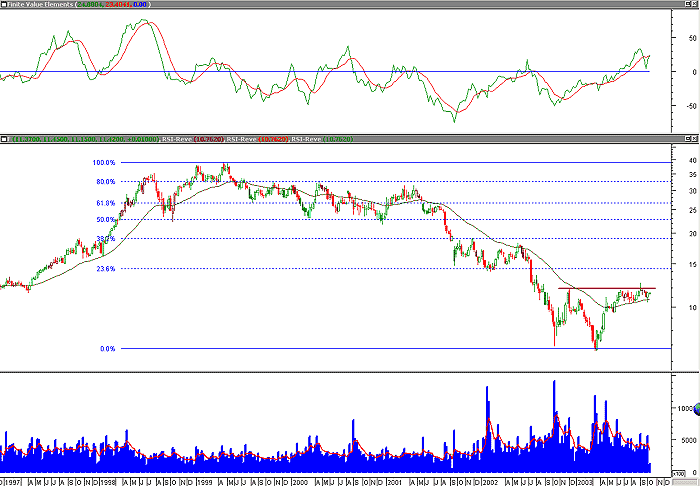
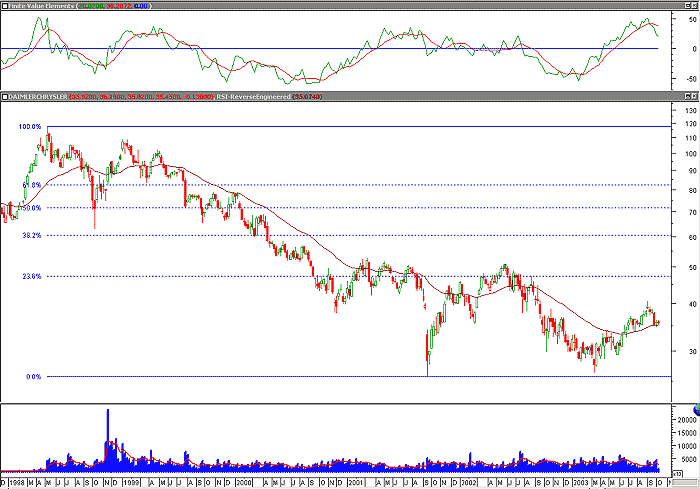
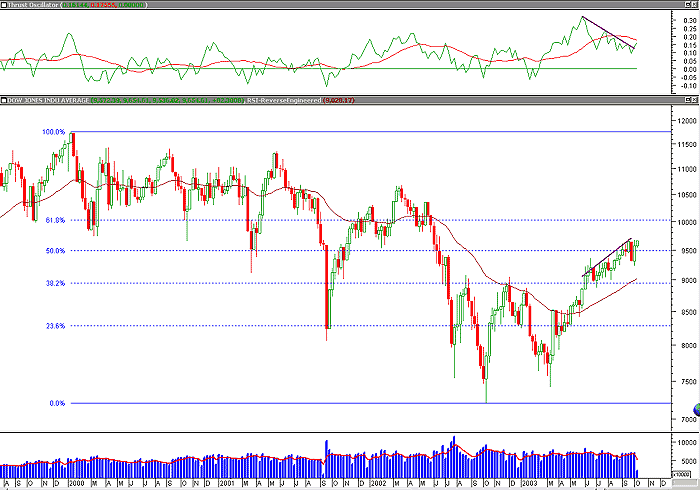
Looking at this from a different angle, the DJIA had retraced approximately 50% from its October lows by late September (see Figure 5) compared to only approximately 20% for GM and Ford (F) (Figures 2 and 3) and 15% for Daimler-Chrysler (Dcx) (Figure 4).
Figure 3: Weekly chart of Ford Motor Co. (F), which also did not hit new highs until the week of September 5.
Figure 4: Weekly Daimler-Chrysler (DCX) chart showing Fibonacci retracement levels from the peak to the October 2002 low. Unlike GM and Ford, the company was at least able to put in a higher low in March than it did in October.
Figure 5: Weekly Dow Jones Industrial Average (DJIA) chart showing retracement between the highs of 2000 and lows of 2002-2003. The thrust oscillator (upper window), a derivation of the Arms index, is showing negative divergence with the DJIA.
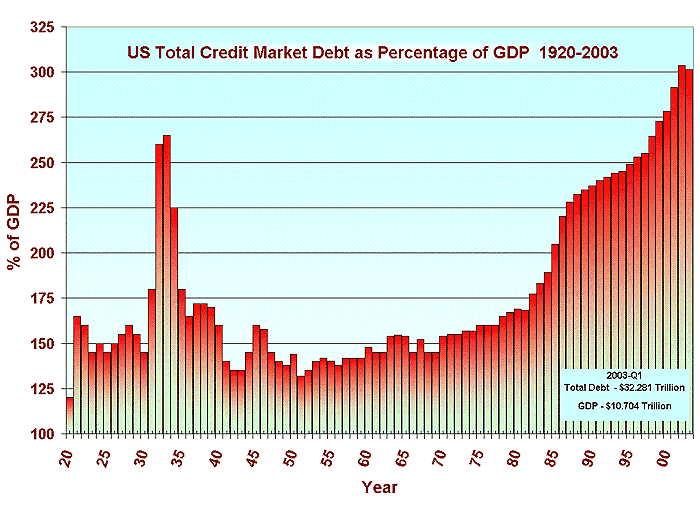
ECONOMIC FUNDAMENTALS: BEAR VS. BULLFrom a fundamental standpoint, there are a number of signs that the economy is on the mend, at least in the short term. Positive earnings reports outweigh negative ones by a fair margin, and interest rates remain low, making loans for consumer purchases and corporate expansion cheap. The housing industry remains robust. In addition, this is the year before a Presidential election, and such years have historically been prosperous — incumbents do everything in their power to ensure that the economy is as strong as possible in an effort to get reelected. President George W. Bush is no exception. But there are significant challenges facing a sustained economic recovery. The level of total credit market debt, all levels of debt from personal to government, is currently in excess of 300% of GDP, which is unprecedented (see Figure 6). In comparison, the level was 265% in 192930 in the US before the Great Depression and approximately 250% in Japan before the bubble broke there in 1989, leading to 13 years of economic malaise. The Nikkei lost more than 80% of its value during the period before recovering somewhat in February 2003.
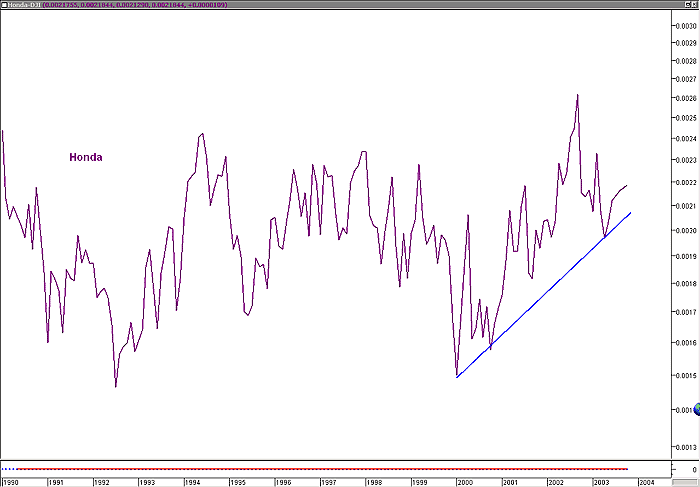
Figure 6: US total credit market debt as a percentage of GDP from 1920 to 2003. (Source: Gabelli Mathers Fund & US Federal Reserve) Charles Minter of Comstock Partners sees debt as the major problem. High valuations at this point in the economic cycle also trouble him. In his opinion, each major market meltdown was caused by the same factor: Debt overwhelmed the system. He and his partner Marty Weiner have put their money where their mouths are. They are 100% short the market and have been since March. They also saw the reversal coming and were short in the late 1990s. That was a profitable ride. The implications for the North American automobile industry are ominous. Even with record sales and interest rates at 50-year lows, the industry faces serious challenges. Any significant increase in interest rates will have a strongly negative effect on sales and further depress margins that are already razor thin; the profit margin at GM was a scant 0.83% and less than half that at 0.4% for Ford in 2002. Daimler-Chrysler lost more than $1 billion in the latest quarter. GM currently suffers from a pension-fund shortfall of $19 billion (equal to the size of the company's market capitalization at May's stock price of $34 per share!), and both it and Ford carry crushing levels of total debt: $232 billion for GM and $175 billion for Ford. If what is good for GM is good for America, from a technical and fundamental perspective, both the industry and overall economy face momentous challenges in the long term. For the short-term trader, these challenges are not so daunting. Bulls can take solace in the fact that since they believe we are in recovery, and GM lags in recoveries according to the four-month rule, the negative divergence can be safely ignored. These traders will use weakness to buy strong stocks or commodities. Stocks like Honda Motor Company (HMC) make far better long or swing-trade candidates than their US counterparts at this point (see Figure 7). Honda has shown surprising relative strength and will continue to attract traders and long-term investors on both sides of the Pacific, especially if markets remain strong in the short to medium term.
Figure 7: Monthly relative strength chart of the Honda Motor Co. (HMC) American Depositary Receipts plotted against the DJIA 19902003. This chart is all the more amazing, considering that the Nikkei peaked at 39,000 in 1989 and dropped more than 80% over the next 12 years, making Honda a great refuge for the Japanese investor.
Money is being printed like it's going out of style. The official excuse according to the Federal Reserve is to avoid the deflation bogeyman, but the more likely motive is a last-ditch effort to get the economy going if George W. has any hope of being reelected. The market meltdown of 2000 occurred on his watch, and he needs to show the nation that he can get the economy going again. It appears that he has pulled out the stops to achieve this end. In this type of environment, for the short term at least, the market could continue to climb the bloated valuations in many sectors and extreme debt "wall of worry"' for some time. Every trader knows that picking a top is dangerous, but the longer the money-printing train hurtles down the track, the greater the devastation of the derailment waiting at the next major curve. Traders who have done their homework will be ready, but those who jump in too early could be in serious trouble. If technical analysis holds any value, it is in the tenet to wait for a trend reversal and then trade with the trend. Since March 2003, the short-term trend has been up, so there is no point in going short until a reversal is confirmed. Bears, however, will view the latest GM negative divergence as another warning to sell on strength. The long-term trend is still down, so they see this as further confirmation that the latest rally is over. Such signals have been reliable in the past, and they will continue to be in the future. GM, Ford, and Daimler-Chrysler have proven that they are good short candidates, especially if we are still in a secular bear. Only time will tell if the bears or the bulls are right.
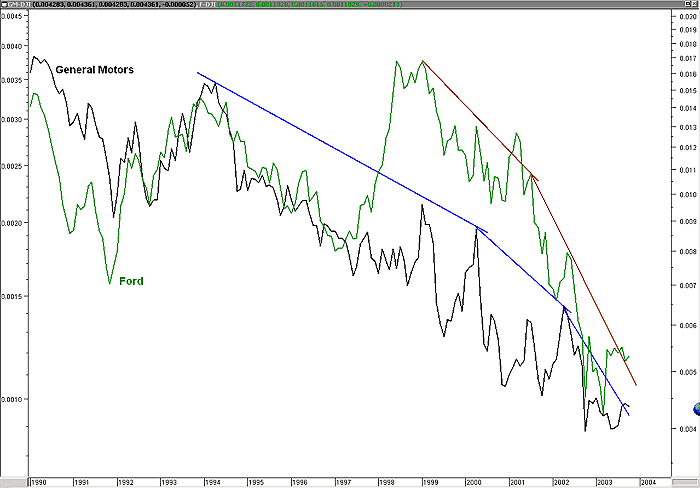
TAKING THE TRADEIntermarket analysis tells us that it is a bad idea to go long in sectors and industries that exhibit declining relative strength, and it is therefore a good idea to avoid the Big Three for long trades given that they are currently dropping like a stone against the DJIA (see Figure 8). If history is any guide, however, the negative divergence between major car manufacturers and the DJIA must be considered troubling at best, given the historical accuracy of the indicator and the industry's importance to the economic strength of the nation.
Figure 8: Monthly chart showing the relative strength of GM and Ford plotted against the DJIA between 1990 and 2003. Both are experiencing declining relative strength, as demonstrated by their trendlines' accelerating negative slope.
GM's stock price has been an accurate historical technical indicator of overall market strength, but only the future holds the answer to whether it will continue to maintain its "extremely good" record. However, traders who have the ability to use both technical and fundamental road signs together have a distinct advantage over purists from either camp.
Matt Blackman is a trader, technical writer, software reviewer, and content provider for technical trading publications and websites. He is an affiliate member of the Market Technicians Association (Mta) and Canadian Society of Technical Analysts (Csta), and is currently enrolled in the Chartered Market Technicians (Cmt) program.
SUGGESTED READINGBlackman, Matt [2003]. "Ten Challenges Facing A Market Rebound," Technical Analysis of Stocks & Commodities, Volume 21: March._____ [2003]. "Are You Trading on Borrowed Time?" Technical Analysis of Stocks & Commodities, Volume 21: November. Pring, Martin [2002]. Technical Analysis Explained, McGraw-Hill. Economist, The [1998]. "The decline and fall of General Motors," October 8. _____ [2000]. "Crunch time for General Motors," December 14. _____ [2003]. "America's car industry," June 12. _____ [2003]. "One hell of a birthday, Bill," June 12. _____ [2003]. "Extinction of the car giants," June 12. MetaStock
Current and past articles from Working Money, The Investors' Magazine, can be found at Working-Money.com. |
Matt Blackman is a full-time technical and financial writer and trader. He produces corporate and financial newsletters, and assists clients in getting published in the mainstream media. He tweets about stocks he is watching at www.twitter.com/RatioTrade Matt has earned the Chartered Market Technician (CMT) designation.
| E-mail address: | indextradermb@gmail.com |
PRINT THIS ARTICLE

Request Information From Our Sponsors
- StockCharts.com, Inc.
- Candle Patterns
- Candlestick Charting Explained
- Intermarket Technical Analysis
- John Murphy on Chart Analysis
- John Murphy's Chart Pattern Recognition
- John Murphy's Market Message
- MurphyExplainsMarketAnalysis-Intermarket Analysis
- MurphyExplainsMarketAnalysis-Visual Analysis
- StockCharts.com
- Technical Analysis of the Financial Markets
- The Visual Investor
- VectorVest, Inc.
- Executive Premier Workshop
- One-Day Options Course
- OptionsPro
- Retirement Income Workshop
- Sure-Fire Trading Systems (VectorVest, Inc.)
- Trading as a Business Workshop
- VectorVest 7 EOD
- VectorVest 7 RealTime/IntraDay
- VectorVest AutoTester
- VectorVest Educational Services
- VectorVest OnLine
- VectorVest Options Analyzer
- VectorVest ProGraphics v6.0
- VectorVest ProTrader 7
- VectorVest RealTime Derby Tool
- VectorVest Simulator
- VectorVest Variator
- VectorVest Watchdog

