HOT TOPICS LIST
- Strategies
- Stocks
- Buy
- Investing
- Brokers
- Psychology
- Interviews
- Accumulate
- Sell
- Hold
- Spotlight
- Websites
- Candlestick Corner
- Gold & Metals
- Options Trading
LIST OF TOPICS
CANDLESTICK CORNER
Stop-Loss Procedures Made Easy
10/29/03 09:46:26 AM PSTby Stephen W. Bigalow
Candlestick analysis can make your life easier when placing stop-losses.
| Candlestick signals can identify highly profitable trades with accuracy, which is what most traders want from their trading programs. However, not every trade is going to work, although we do not always accept that. As effective as candlestick analysis is for identifying high-profit moves, it is equally effective for revealing when a trade is not going to work.
IMPORTANCE OF STOP-LOSSESIn trading, protecting your assets is essential, which is why stop-losses are a recurring topic in technical analysis. Many trading strategies incorporate stop-losses into their trading formulas in order to close trades that have gone sour. Usually, a percentage loss is established as a parameter, but there is a major flaw in using a prescribed percentage as the stop-loss: Your purchase price becomes an important function of when you can stop out. Some investment advisors recommend 3% as the stop-out level, while others might suggest 8%. What is the problem with basing your stops on a percentage? Suppose a buy recommendation is placed on a stock. You are advised to place a stop at a preset number say, 3% below your entry price. You place a buy on a stock at $50. However, by the time you get executed, you end up paying $50.80. Buying the stock at $50 would have meant your stop level was $48.50. Your entry at $50.80 now means the stop-loss is to be placed at $49.27. This arbitrary level has absolutely nothing to do with what the price trend should be doing. What if the $48.50 level negates the uptrend move, but $49.27 is insignificant to trend direction? You could get stopped out while the trend direction is still valid. In addition, the volatility of a particular stock must be considered when deciding whether a trend has been affected by a given move. A 3% pullback on some stocks might be more than enough to reverse a trend, while a 10% move in other stocks might be common and not a factor in trend direction. The most important component for establishing a stop-loss is basic. What price point would indicate that the established trend has been negated? If you opened a long position based on a bullish buy signal, what level would price have to fall to in order to confirm that the sellers were still in control? It is also important to know which direction the markets are moving. Logic suggests that if the markets are in a downtrend and a buy signal appears in a specific stock, the stock price needs to be followed more closely compared to a buy signal that appears when the markets are in an uptrend.
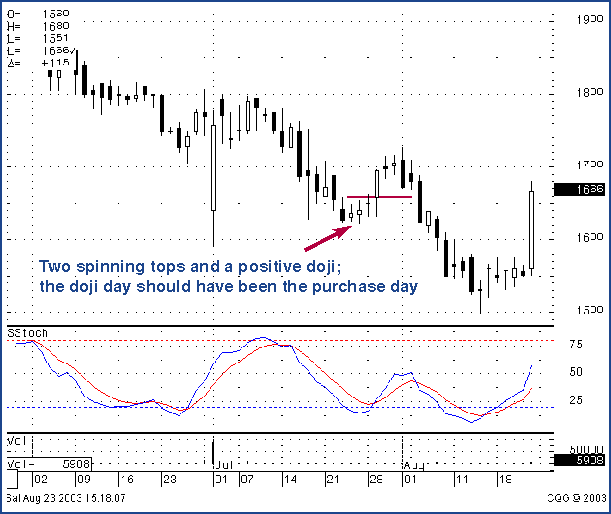
WHERE TO PLACE STOPSA simple evaluation establishes the stop-loss point after you take into consideration the stock's volatility and the conditions that created the buy signal. A stop-loss on one stock may be relevant at a close level, whereas another stock position might require greater latitude. Candlestick analysis allows the investor to establish a stop-loss that would indicate whether the sellers were still in control. Determining when to stop out of a trade becomes easier when you know what the signal indicates. For instance, a buy signal indicates a new trend. Keep in mind that being in that trade has favorable odds for profitability, not any guarantees. Even though most of the trades will work as indicated by the signals, that also means some trades won't work. With this in mind, stop-loss analysis creates a format to identify when a trade is not working so you can exit as quickly as possible. Establishing the stop-loss point involves the same commonsense approach that denotes the candlestick method. Take a look at the chart of Wynn Resorts Ltd. in Figure 1 and note the two spinning tops on July 23 and 24. The gap up on July 28 should have been the buy signal, with the entry at $16.50. The next day, you see a big bullish candle followed by a couple of dojis. The bearish engulfing signal the following day, with stochastics still heading up, might not have been enough to convince anybody this uptrend was over. What would indicate the trend was no longer heading up? The bottom of the large white body on July 29 looks like a logical level. If sellers take prices down through that level, the trend is obviously not up anymore.
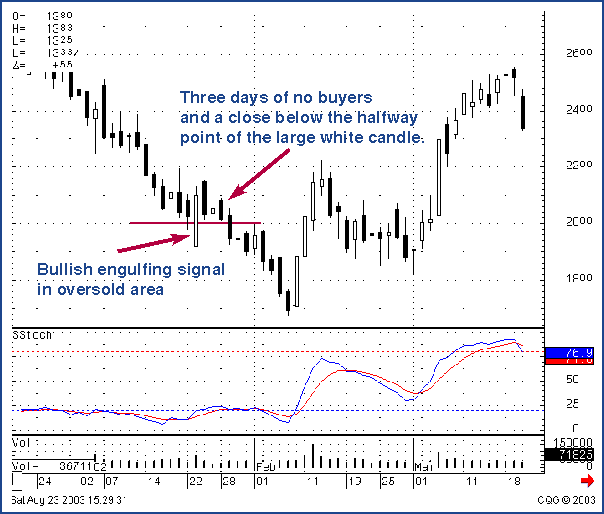
Figure 1: Placing stops. Here the bottom of the large white body on 7/29 becomes a logical point for a stop-loss. You can break even on this trade, which is not bad at all. Candlestick signals provide an extra day or so by getting you in earlier than other technical methods that need more confirmation. Getting in that much sooner makes the sell-stops more effective. What are you expecting to see after a buy signal? More buying, of course. That sounds trite, but it's exactly what the buy signals should reveal. Note the bullish engulfing pattern on January 23, 2002, in the Millennium Pharmaceutical chart (Figure 2). Stochastics are oversold and turning up. The next day, the bullish engulfing signal is followed by a gap-up open. This is the perfect buy scenario. However, as you can see, prices close lower that day. This should not be disconcerting; it isn't unusual to see residual selling from the previous trend. It's most important that a bullish engulfing signal has appeared in an oversold area. There is a spinning top signal the following day, a good sign, as it suggests the selling of the previous day may have stopped. The day after that, you see a higher open but then a lower close. What can we glean from the chart at that point? The obvious: There was no extensive buying for three days after the buy signal. Logic tells us that if a buy signal occurs, we should see the buyers continuing the trend.
Figure 2: A failed signal. After the bullish engulfing buy signal there is no extensive buying, which suggests it would be best to close the trade. The fourth day after the signal results in a close more than halfway down the bullish engulfing candle body. The halfway point is significant: The sellers are now more evident than the buyers who originally formed the signal. The sellers are stronger, so it's time to get out of the trade. In addition, no buyers have come forth four days after the buy signal. The trend is not up, so again it's time to move on to another trade. The halfway point is the pivotal point. This works for both directions bullish and bearish trend reversals. Does that mean the trade should be ignored? Definitely not! A buy signal that appeared in oversold conditions was the reason for buying in the first place. The conditions have not changed. If the first entry does not work, keep an eye open for the next buy signal. That will be stronger, because the sellers will see that even though they overcame the first buy signal, a second one indicates that new buying is starting again. The sellers might now get out of the way.
CANDLESTICK SIGNALSLet the signals tell you when to enter a trade and let the chart tell you when a signal is not working. By doing so, you will be able to eliminate the emotion/ego from your decisions. More likely than not, you will be able to make a profitable trade when you see a candlestick buy signal in an oversold condition. When the sellers are still in control, close the position. There are high-profit trades waiting for you every day. Get out of the trades that do not indicate that buyers abound. Cutting losses short and letting profits run is easy when you can see what the buyers and sellers are doing.
Stephen W. Bigalow is the author of Profitable Candlestick Trading and the principal of www.candlestickforum.com.
Current and past articles from Working Money, The Investors' Magazine, can be found at Working-Money.com.
|
Stephen W. Bigalow is an author and the principal of the www.candlestickforum.com, a website for providing information and educational material about candlestick investing.
| Website: | www.candlestickforum.com |
| E-mail address: | sbigalow@msn.com |
PRINT THIS ARTICLE

|

Request Information From Our Sponsors
- StockCharts.com, Inc.
- Candle Patterns
- Candlestick Charting Explained
- Intermarket Technical Analysis
- John Murphy on Chart Analysis
- John Murphy's Chart Pattern Recognition
- John Murphy's Market Message
- MurphyExplainsMarketAnalysis-Intermarket Analysis
- MurphyExplainsMarketAnalysis-Visual Analysis
- StockCharts.com
- Technical Analysis of the Financial Markets
- The Visual Investor
- VectorVest, Inc.
- Executive Premier Workshop
- One-Day Options Course
- OptionsPro
- Retirement Income Workshop
- Sure-Fire Trading Systems (VectorVest, Inc.)
- Trading as a Business Workshop
- VectorVest 7 EOD
- VectorVest 7 RealTime/IntraDay
- VectorVest AutoTester
- VectorVest Educational Services
- VectorVest OnLine
- VectorVest Options Analyzer
- VectorVest ProGraphics v6.0
- VectorVest ProTrader 7
- VectorVest RealTime Derby Tool
- VectorVest Simulator
- VectorVest Variator
- VectorVest Watchdog


