HOT TOPICS LIST
- Strategies
- Stocks
- Buy
- Investing
- Brokers
- Psychology
- Interviews
- Accumulate
- Sell
- Hold
- Spotlight
- Websites
- Candlestick Corner
- Gold & Metals
- Options Trading
LIST OF TOPICS
TRADER'S NOTEBOOK
Adjusting Indicators For Entry And Exit
11/12/03 04:07:18 PM PSTby Dennis D. Peterson
The indicator you use to signal entries is not necessarily the best one to use for exits.
| In a bull market prices can remain overbought, but usually stay oversold for only a short while. Your best strategy is to combine an entry-side indicator that reacts very quickly and an exit-side indicator that is slow to react. Conversely, in a bear market you flip the indicators around and take short positions rather than long ones. (In terms of pure trading, once you see a top, you might also consider selling a call option to milk the last few dollars out of the runup, while on the short side if you see a bottom you may consider selling a put option -- but these are refinements for another article.) To try out this combination, I first selected Williams' %R for my entry-side indicator. Steven Achelis wrote this about Williams' %R in his Technical Analysis From A To Z: "An interesting phenomenon of the %R indicator is its uncanny ability to anticipate a reversal in the underlying security's price." Sounds like an endorsement! Williams' %R calculates a range of prices from the highest high to the lowest low over the periods selected. It then compares today's close to the highest high versus this range. It is calculated as follows:
(Highest high - today's close)/(Highest high - lowest low) Some products multiply the result by -100, so the range of values for Williams' %R goes from zero to -100 rather than zero to 1. If you plan to take long positions, you may prefer an indicator that reacts more slowly for the exit, because you want to take advantage of staying oversold in a bull market. For simplicity's sake, I used Williams' %R for both exit and entry. But rather than just plug in some numbers and see if I made a profit, I had the software optimize on periods for both the entry and exit. This way, the optimizer will reveal if the best answer is to have longer periods for exit and shorter ones for entry. I will also have to optimize the thresholds to allow an open choice of periods. Finally, since I am using a bull market, I need to compare my results with buy and hold results. Can I do better? Let's give it a try.
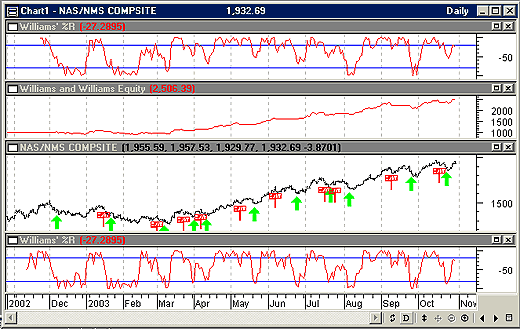
WILLIAMS' %R FOR ENTRY AND EXITThe result of using Williams' %R is an equity curve with a steady climb and no serious drawdowns (Figure 1, second chart from top). I did use a pair of %R indicators for both exit and entry, because in both cases I wanted to see the %R break a threshold and then reverse and go through a second threshold. For example, on entry I started with %R going below -80 and then going above -80. I then let the optimizer find the thresholds that would work best. I had to use the alert function so I could pose the strategy in this way: If the current value of %R is greater than a threshold, was %R less than a threshold a few days ago? — If true then enter (exit) the long position. Here is the MetaStock code for this strategy:
MetaStock code for entry: cond1:=Alert(WillR(opt1)<opt2,opt9); cond2:=WillR(opt3)>opt4; cond1 AND cond2
MetaStock code for exit: cond1:=Alert(WillR(opt5)>opt6,opt10); cond2:=WillR(opt7)<opt8; cond1 AND cond2
Figure 1: Daily Nasdaq Composite data. The bottom chart shows %R values for the first condition for entry, identified as "cond1" in the code, and the top chart shows the %R values for the first condition for exit, also identified as "cond1." The second chart is the equity curve, which started with $1,000, used 50% margin, and entered with a one-day delay. The third chart down is the price chart annotated with green up entry arrows and red exit signs.
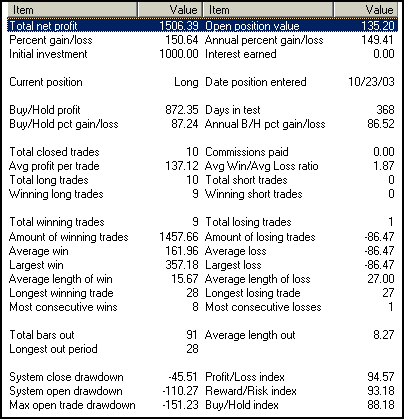
As you can see, there are 10 optimization variables. Being limited to 32,000 combinations prevented me from having both a wide range and small increments for each of the optimization variables. I had to start with a rough optimization parameter range, then slowly narrow the range to get to an answer. This is where a genetic algorithm can be a big help. Even so, I can't be sure this is the absolute best answer, but all I am looking for is confirmation that a "best" system has longer periods for the exit than the entry for taking long positions in a bull market. The answer for opt1, . . . , opt10 is 12, -70, 4, -100, 20, -30, 8, -40, 2, and 2. So for entry, one of the %R indicators uses 12 periods, and for exit the comparable %R uses 20. Twenty periods for the initial %R is probably not high enough, in fact, but the difference is sufficient to illustrate the point. When you examine the trading performance (Figure 2), you see that the system achieved nine winners out of 10 trades. (Since commissions were so low and there were so few trades, I didn't go back and rerun the optimization with commissions.) This result is remarkable, even considering that everything was optimized. You have a 150+% annual gain for the trading system versus 87% for buy and hold. Again, my point is only to illustrate that you can do better by trading than by using a buy and hold strategy if you adjust your parameters for entry or exit. The key factors, setting aside the optimization, were the use of a system designed for a bull market and a sensitive indicator.
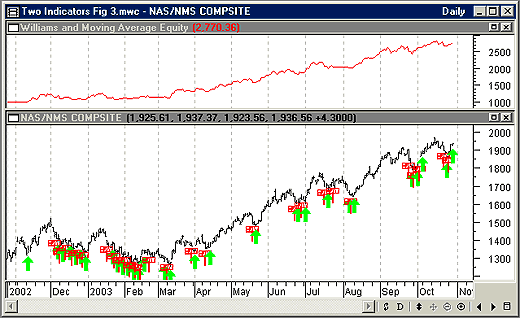
Figure 2: Trading performance using Williams' %R for entry and exit. Using a system with a high degree of optimization gives remarkable results. Despite optimization it is difficult, in general, to achieve this kind of performance. The key factors making this possible were the use of a system designed to take advantage of a bull market and a highly sensitive indicator. Therefore, one of the lessons of this exercise is that you need to know whether you are in a bull or a bear market. WILLIAMS' %R FOR ENTRY AND MOVING AVERAGE FOR EXITJust how good is Williams' %R compared to other indicators? I tried a number of combinations by substituting different indicators for the exit, since Williams' %R looked about as good as you might expect for entry. Applying a moving average yielded typical results. These results (Figure 3) are not quite as good as the results yielded by Williams' %R. You'll notice a lot of entries and exits at the beginning of the chart (late 2002) as prices were moving sideways.
Figure 3: Nasdaq daily data. The trading system used Williams' %R for entry, per the entry rules in Figure 1, and for exit used today's close < moving average of closing prices. The period used in the moving average was optimized. By comparing the results between this entry/exit performance and Figure 1, it is easy to see that even an optimized moving average keeps pulling you out of your long position much more than does Williams' %R. This results in more trades and slightly less profit.
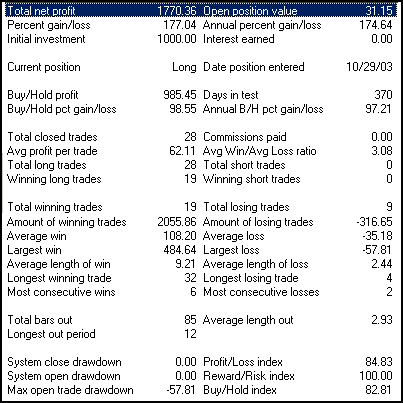
The trading system rules I used for entering the trade for this second system were the same Williams' %R rules as in the first system (Figure 1), but to exit the trade I used the following rule: Today's close < Simple moving average of daily closes (Figure 4). I optimized on the moving average periods for the exit, as well as the periods and thresholds for entry. You can see that my choice of trading period was a bit biased, since it is not a pure bull run. I allowed the latter part of 2002 to be traded, when price was moving sideways, and the moving average entries are much more numerous. I did all this because the last part of this puzzle is to make these adjustments in entry and exit periods when you are in a bull market, and there is the chance you might jump the gun by a few months. What you use for determining bullish versus bearish market conditions might get you in a little too soon, because the market is always pricing the expectation of the news. When the actual news hits, it is usually a little late to enter a position.
Figure 4: Trading performance using Williams' %R for entry and moving average for exit. There were 28 trades compared to 10 when using the Williams system for both entry and exit.
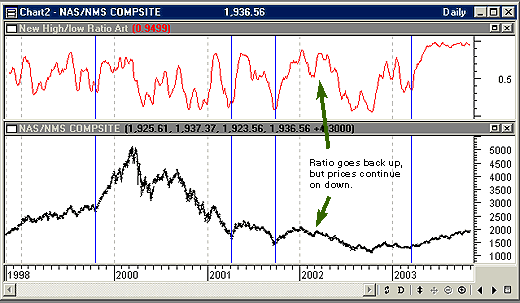
BULL VERSUS BEARI like to use a number of items to confirm a bull versus a bear market. I like to see that the yield curve of short-term to long-term Treasuries has a bullish pattern (see the websites listed at the end of this article). Interest rates play a major role in what the market expects the economy to do. Low rates are generally bullish, whereas high rates are generally bearish. I pay attention to the economic news such as employment figures, Federal Reserve action, and how the market is reacting to the news. One of the measures I use for the market reaction is the ratio of 52-week new highs to (new highs + new lows). I mostly follow the Nasdaq, so the chart you see in Figure 5 is for the Nasdaq new highs and new lows:
Figure 5: Daily Nasdaq Composite and 10-day SMA of Nasdaq new highs / (new highs + new lows). The blue vertical lines are points where a potential bull market might have started or did start. In each instance the ratio responds quickly, but there are some false starts such as in early 2002 when an increase might have signaled an upturn in prices, but the Composite went down. It is difficult not to have some losers.
As you can see (Figure 5), the ratios are a fairly dependable barometer. But like all indicators, this method has its bad moments, as evidenced by the continued fall of prices in the beginning of 2002 while the ratio took a bounce up.
SUMMARYThere is considerable gain to be made if you adjust the indicators you are using to reflect the bullishness or bearishness of the market by adjusting the number of periods used for entry versus exit. Williams' %R can achieve some spectacular results, but obviously this is the best case. An underlying assumption is that you need to determine whether the market has turned bullish versus bearish. Using the ratio of 52-week new highs and lows is one of several methods that can work.
Dennis Peterson may be reached at DPeterson@Traders.com.
YIELD CURVE WEBSITESFed funds rate forecasts, based on 30-day federal funds futures traded on the Chicago Board of Trade: The Living Yield Curve: Dynamic Yield Curve
Current and past articles from Working Money, The Investors' Magazine, can be found at Working-Money.com.
|
Market index trading on a daily basis.
| Title: | Staff Writer |
| Company: | Technical Analysis, Inc. |
| Address: | 4757 California Ave SW |
| Seattle, WA 98116-4499 | |
| Phone # for sales: | 206 938 0570 |
| Fax: | 206 938 1307 |
| Website: | working-money.com |
| E-mail address: | dpeterson@traders.com |
Traders' Resource Links | |
| Charting the Stock Market: The Wyckoff Method -- Books | |
| Working-Money.com -- Online Trading Services | |
| Traders.com Advantage -- Online Trading Services | |
| Technical Analysis of Stocks & Commodities -- Publications and Newsletters | |
| Working Money, at Working-Money.com -- Publications and Newsletters | |
| Traders.com Advantage -- Publications and Newsletters | |
| Professional Traders Starter Kit -- Software | |
PRINT THIS ARTICLE

|

Request Information From Our Sponsors
- StockCharts.com, Inc.
- Candle Patterns
- Candlestick Charting Explained
- Intermarket Technical Analysis
- John Murphy on Chart Analysis
- John Murphy's Chart Pattern Recognition
- John Murphy's Market Message
- MurphyExplainsMarketAnalysis-Intermarket Analysis
- MurphyExplainsMarketAnalysis-Visual Analysis
- StockCharts.com
- Technical Analysis of the Financial Markets
- The Visual Investor
- VectorVest, Inc.
- Executive Premier Workshop
- One-Day Options Course
- OptionsPro
- Retirement Income Workshop
- Sure-Fire Trading Systems (VectorVest, Inc.)
- Trading as a Business Workshop
- VectorVest 7 EOD
- VectorVest 7 RealTime/IntraDay
- VectorVest AutoTester
- VectorVest Educational Services
- VectorVest OnLine
- VectorVest Options Analyzer
- VectorVest ProGraphics v6.0
- VectorVest ProTrader 7
- VectorVest RealTime Derby Tool
- VectorVest Simulator
- VectorVest Variator
- VectorVest Watchdog

