HOT TOPICS LIST
- Strategies
- Stocks
- Buy
- Investing
- Brokers
- Psychology
- Interviews
- Accumulate
- Sell
- Hold
- Spotlight
- Websites
- Candlestick Corner
- Gold & Metals
- Options Trading
LIST OF TOPICS
MARKET UPDATE
The Rally Rolls On
11/19/03 04:28:42 PM PSTby David Penn
Transports, triple bottoms, and third waves: the three Ts of higher stock prices in the near term.
No one seems to have hit on it yet, but there are many reasons why the current economic recovery could easily develop into an eight- or 10-year boom, much like the prosperity cycles of 1982-90 and 1992-2000.— Larry Kudlow, "Rising to the Occasion,"
Radio commentator and former hedge fund manager Jim Cramer hasn't moved off from his throne as king of the bulls. Although more than a few money managers and analysts "called" the broad-based stock rally that began in March 2003, Jim Cramer's gift of gab and rhetorical flair — calling the March lows "the exquisite moment" — helped cement his status in the minds of many as the man who called "the move" weeks before it began. So it is all the more interesting to hear the likes of Cramer warning about a possible "parabolic move to the upside" in the stock market, one that would bring to an abrupt end this dizzying nine-month bull market. The final strike against the market, in Cramer's view, would be an increase in short-term interest rates — though Cramer recently suggested that it would take three cuts to finally fell the strange and virtuous beast that this market has become. How likely is a parabolic move to the upside, or any move to the upside, for that matter? Cramer is among those fundamentalists who have little time for such things as head & shoulders patterns and triple bottoms (though Cramer has all the admiration in the world for the talented market technician he refers to as "The Trading Goddess" — his wife). But there is an array of technical market approaches from Dow theory to Elliott wave patterns that have been effective in anticipating the rally. Perhaps they will be equally effective in letting investors and traders know when the tide is about to turn against them.
TRANSPORTS AND TRIPLE BOTTOMSThe price action of the Dow transports since the March bottom (Figure 1) has been most impressive. And, most recently, the transports have done what they have during every rally in this bear market since 2000: moved above their 200-week simple moving average. What is particularly interesting about this third in the set of rallies is that previous 200-week moving average penetrations in the autumn of 2000 and the spring of 2002 were brief affairs lasting less than a month. Even though the Dow transports were actually lower at the March bottom than they were at the October bottom (1918 in March compared to 1942 in October), the transports cleared the 200-week moving average barrier in August and, save for a sharp down week in late September that was swiftly and completely retraced one week later, really have not looked back as they marched toward 3000. Insofar as Dow theory posits that the Dow transports and industrials must confirm each other's price action, the continued resilience of the transports — even given some of the sluggishness in the industrials in October — is a bullish sign for the DJIA.
Figure 1: The Dow transports have taken out their 200-week moving average near bear market rally peaks.
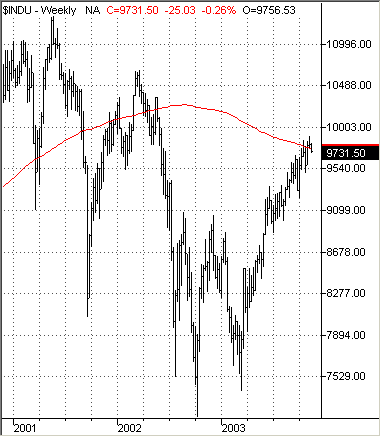
The triple bottom — most evident in weekly charts of the Dow industrials and the Standard & Poor's 500 — continues to climb toward its price objective (Figures 2 and 3). While some technicians may have been tempted to invalidate the breakout in July when prices first began to stall across most major equities proxies, the evidence clearly shows that the breakout has resumed, if indeed it did stall. The triple bottoms formed from the declines in July 2002, October 2002, and March 2003 provide for upside price targets of 10,802 in the industrials and 1162 in the S&P 500. This suggests that there is technical support to the notion that both the industrials and the S&P 500 are likely to move higher. At present the Dow industrials are at their 200-week moving average (approximately 9700), which suggests the possibility of some short-term resistance. The S&P 500 finds its 200-week moving average at about 1145 — 100 points from current levels and quite near the price projection from its triple bottom.
Figure 2: A test of resistance develops at the 200-week moving average for the Dow industrials.
The combination of these factors (the idea of the transports typically leading the industrials in a bull market and the technical rebound from a series of significant price troughs in the spring 2002, fall 2002, and spring 2003 declines) paints a simple but compelling picture of a stock market that has enough requisite characteristics to move higher. However overvalued the stocks that make up this market may become, however speculative many of the names that have led this market may be, however vigorously corporate insiders contribute to the supply of stocks with equities that were once their own, the reality of the matter is that investor psychology is sufficiently optimistic that buyers continue to overwhelm sellers.
Figure 3: This triple bottom in the S&P 500 continues to suggest higher prices.
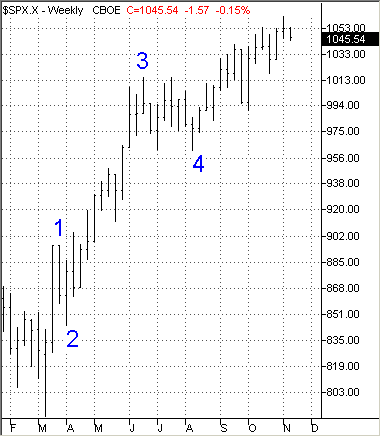
. . . AND THIRD WAVESI mentioned Elliott wave theory as among those technical approaches that could have been used to anticipate this rally. Although an Elliottician could be forgiven for thinking that this rally would end sooner than it has, believing in the staying power of the rally should perhaps be a required conviction. One of the more persuasive wave interpretations of the S&P 500 since the market topped in 2000 locates the market in the third, bullish wave of a larger, fundamentally countertrend market movement that began in October 2002. The components of this larger, countertrend move consist of three waves: an advance from October to the beginning of December 2002, a decline from December 2002 to March 2003, and the current advance from the March 2003 lows. This three-wave movement is generally thought to represent what Elliotticians refer to as a flat — or perhaps an expanded flat, to take account of the extended nature of the third part of the move from March. As the third wave in the flat, the move from March can be broken down into five subwaves (as compared to the three subwaves that each of the earlier two waves in the flat can be divided into). At present, the most compelling wave labeling of these five subwaves suggests that the S&P 500 has moved into the fifth and final subwave (Figure 4), after which the market should top and begin to move in the opposite direction.
Figure 4: Four down, one to go? This Elliott wave count of the rally since March 2003 has the S&P 500 in a fifth and final wave.
How close is such a fifth and final subwave to completion? One method of projection championed by Robert Fischer in his book Fibonacci Applications And Strategies for Traders calls for averaging two Fibonacci-based calculations. The first calculation calls for multiplying the length of wave 1 by 1.618 and adding that product to the value at the end of wave 1. The second calculation calls for multiplying the length of wave 3 by 0.618 and adding that product to the value at the end of wave 3. The results of these calculations are added and divided by two to get a projection for wave 5. Wave 1, which began on March 12 at 789, ended on March 21 at 896. Wave 3 advanced to 1015 and ended on June 17.
Wave 1: 896 - 789 = 107 x 1.618 = 173 + 896 = 1069 Wave 3: 1015 - 789 = 226 x 0.618 = 140 + 1015 = 1155
1155 + 1069 / 2 = 1112
This "Fischer method" of projection anticipates a wave 5 top — and, consequently, the end of the March bull market — at an S&P 500 of 1112. I have found Fischer's projections to be perhaps more worthwhile for positing a range of likely values — that is, that the S&P 500 would advance at least to 1069, but probably not move much further than 1155 — rather than picking a specific number by averaging waves 1 and 3. But the point to be underscored here is that while Elliotticians have only increasingly been considered an insufferably bearish lot, there is room for some bullishness even for those who follow the Elliott wave way of looking at the stock world.
David Penn may be reached at DPenn@Traders.com.
SUGGESTED READINGCramer, James [2003]. "Cramer's Playbook For The Rally," Real Money, The Street.com: October. |
Technical Writer for Technical Analysis of STOCKS & COMMODITIES magazine, Working-Money.com, and Traders.com Advantage.
| Title: | Traders.com Technical Writer |
| Company: | Technical Analysis, Inc. |
| Address: | 4757 California Avenue SW |
| Seattle, WA 98116 | |
| Phone # for sales: | 206 938 0570 |
| Fax: | 206 938 1307 |
| Website: | www.traders.com |
| E-mail address: | DPenn@traders.com |
Traders' Resource Links | |
| Charting the Stock Market: The Wyckoff Method -- Books | |
| Working-Money.com -- Online Trading Services | |
| Traders.com Advantage -- Online Trading Services | |
| Technical Analysis of Stocks & Commodities -- Publications and Newsletters | |
| Working Money, at Working-Money.com -- Publications and Newsletters | |
| Traders.com Advantage -- Publications and Newsletters | |
| Professional Traders Starter Kit -- Software | |
PRINT THIS ARTICLE

Request Information From Our Sponsors
- StockCharts.com, Inc.
- Candle Patterns
- Candlestick Charting Explained
- Intermarket Technical Analysis
- John Murphy on Chart Analysis
- John Murphy's Chart Pattern Recognition
- John Murphy's Market Message
- MurphyExplainsMarketAnalysis-Intermarket Analysis
- MurphyExplainsMarketAnalysis-Visual Analysis
- StockCharts.com
- Technical Analysis of the Financial Markets
- The Visual Investor
- VectorVest, Inc.
- Executive Premier Workshop
- One-Day Options Course
- OptionsPro
- Retirement Income Workshop
- Sure-Fire Trading Systems (VectorVest, Inc.)
- Trading as a Business Workshop
- VectorVest 7 EOD
- VectorVest 7 RealTime/IntraDay
- VectorVest AutoTester
- VectorVest Educational Services
- VectorVest OnLine
- VectorVest Options Analyzer
- VectorVest ProGraphics v6.0
- VectorVest ProTrader 7
- VectorVest RealTime Derby Tool
- VectorVest Simulator
- VectorVest Variator
- VectorVest Watchdog


