HOT TOPICS LIST
- Strategies
- Stocks
- Buy
- Investing
- Brokers
- Psychology
- Interviews
- Accumulate
- Sell
- Hold
- Spotlight
- Websites
- Candlestick Corner
- Gold & Metals
- Options Trading
LIST OF TOPICS
TRADER'S NOTEBOOK
The Math Behind The System
12/03/03 01:02:48 PM PSTby Richard L. Weissman
What's the benefit of mechanical trading systems?
| In contrast to classical technical analysis, which attempts to capitalize on price history patterns subject to interpretation, mechanical technical analysis is objective and the buy and sell signals it generates are indisputable. It is the objectivity of trading signals derived from mathematical technical analysis that makes them the indispensable foundation of the majority of mechanical trading systems. Mechanical trading systems can be defined as a method of generating trading signals and quantifying risk independent of a trader's discretion. Although the advantages of utilizing a mechanical trading system are many, most market participants agree that their greatest benefit is in the tempering of emotions that can otherwise be destructive to the decision-making process.
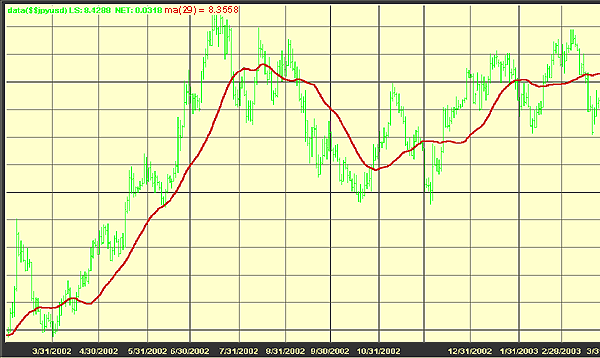
MATH AND TECHNICAL ANALYSISThe simplest and most popular of the mathematical technical indicators is the moving average (see Figure 1). The moving average is the average price of a specific dataset. For example, if you were interested in knowing the 29-day simple moving average for the yen-US dollar, you would add up the settlement prices of the prior 29 trading days and then divide the total by 29.
Figure 1: The moving average. During an uptrend prices will be above the moving average. When prices fall below that moving average, it's an indication of a possible trend reversal. As each trading day is completed, the data from the oldest day — 30 trading days ago — drops from the moving average calculation and is replaced by the new settlement price, hence the term "moving average." The theory behind using a moving average is that if the market is in a significant uptrend, prices should not be weak enough to fall below the 29-day moving average. Once the market is weak enough to breach the moving average, it suggests the end of the old uptrend and the start of a new downtrend. Because the moving average not only produces objective trading signals but also quantifies risk, it is considered to be a technical indicator as well as a mechanical trading system, albeit the most simplistic one possible. Since buy and sell signals are generated whenever the moving average line is violated, it is referred to as a "stop and reverse" trading system. Whenever the market becomes weak enough to close below the moving average line, you exit all existing long positions and initiate new short positions. Although a 29-day moving average is usually too simplistic to act as a successful mechanical trading system in and of itself, it shows what technicians mean when they refer to "objective, mathematical indicators."
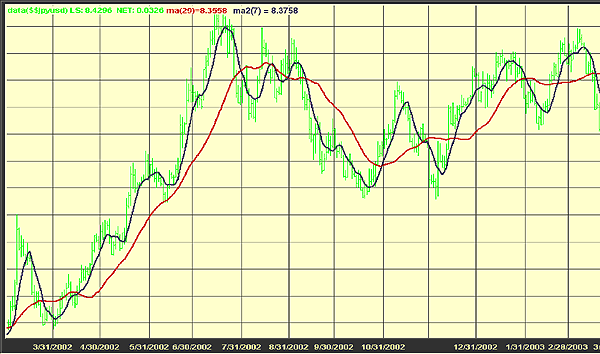
TREND-FOLLOWING AND COUNTERTREND INDICATORSAround 70% of the time, prices trade in a sideways or range-bound pattern. Thus, markets are only in a trending mode around 30% of the time. In statistical terms, commodity and financial markets are said to be leptokurtic — that is, prices tend to cluster around the mean. Why, then, are so many technical analysts and mechanical trading systems dedicated to trend identification? When prices are not in this mean reversion mode, they tend to trend. Commodity and financial markets are said to be leptokurtic with "fat tails," meaning that when they are not in their mean reverting mode they tend to display powerful and sustainable trends. These trends offer traders low-risk, high-reward opportunities, such that a single profitable trend-following trade will often offset numerous small losses. This results in an overall profitable trading system that experiences win/loss ratios of less than 1 to 1. The 29-day moving average examined earlier provides you with an excellent example of a trend-following indicator. Another popular variation on this mathematical trend-following indicator is known as the two-moving average crossover system (see Figure 2).
Figure 2: The two-moving average crossover system. Establish long positions when the shorter-term moving average crosses over and closes above the longer-term moving average.
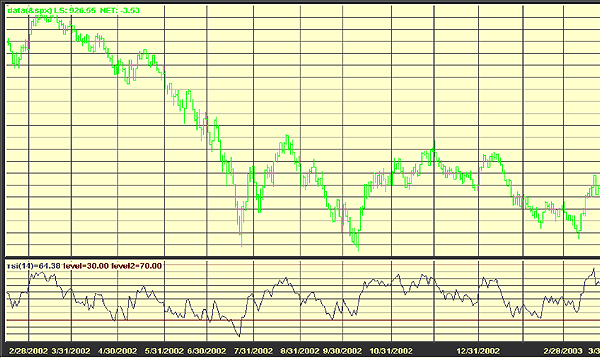
The two-moving average crossover system entails the introduction of a second, shorter-term moving average, such as a seven-day moving average. Now, instead of buying or selling whenever the market closes above or below the 29-day moving average, the trend-following trader establishes long positions whenever the shorter-term moving average crosses over and closes above the longer-term moving average. Whenever the shorter- term moving average crosses over to close below the longer-term moving average, the trader would exit all long positions and initiate short positions. In contrast to trend-following indicators such as the two-moving average crossover, mathematical countertrend indicators such as the relative strength index (RSI) (see Figure 3) attempt to capitalize on the market's tendency toward mean reversion.
Figure 3: The relative strength index (RSI). It indicates when a market is overbought or oversold.
In 1978 J. Welles Wilder, who developed many commonly used mathematical technical indicators, developed the RSI to provide traders with an objective tool for measuring when a market becomes either overbought or oversold. The "strength" of the market is measured by the following formula:
RSI = 100 100/1+RS
where: RS = Average of x days when the market closed up/Average of x days when the market closed down.
Fourteen periods, such as days or weeks, are most commonly used in calculating the RSI. To determine the average up value, we add the total points gained on up days during the 14 days and divide that total by 14. To determine the average down value, add the total points lost during the down days and divide that total by 14. Most traders define a market as overbought when the RSI closes above 70 and oversold when the RSI closes below 30. TREND-FOLLOWING AND COUNTERTREND TRADING SYSTEMS Although the two-moving average crossover system is similar to the single moving average system in that it is also a trend-following stop-and-reverse trading system, it differs from the single simple moving average. The two-moving average crossover system is robust enough to produce profits in markets such as foreign exchange and short-term government debt instruments, both of which display a propensity toward long, sustainable trends. Here are the results of employing the seven- and 29-day moving-average crossover system in the yen-US dollar:
Note that this simple trend-following trading system produced significant profits, even though it suffered almost twice as many losing trades as winners. Unlike the two-moving average crossover system, Wilder's RSI is merely a technical indicator that generates buy and sell signals, not a comprehensive mechanical trading system. Since RSI attempts to identify when markets are overbought or oversold in hopes of exiting when mean reversion occurs, it is unrealistic to simply buy whenever RSI closes below 30 and sell when it closes above 70. As a result, in order to turn this indicator into a mechanical trading system, you will have to address two issues: exiting with profits and exiting with losses. The first part of the exit plan can be accomplished by deciding to exit long positions whenever the RSI closes above 35 and exit short positions whenever the RSI closes below 65. But what if you initiate entry positions and the market continues to trend? If this occurs it could take months for RSI to achieve either closes above 35 or below 65, and you would have failed to successfully quantify and limit risk. As a result, we need a fail-safe exit strategy in order to limit risk if the market does not revert toward the mean. This can be accomplished in many ways, but perhaps the simplest is the utilization of a stop-loss exit based upon a percentage of the trading instrument's value at the time of entry. For the Standard & Poor's 500 I will use 7.5% of the instrument's value. This will give you enough room to allow for "normal" market fluctuations without prematurely stopping you out of your position prior to mean reversion. At the same time, it will ensure that a single trend does not wipe out several years of profitable trading. Here are the results from the mechanical "RSI trading system" for the S&P 500:
Despite having to endure fewer losing trades than the trend-following system, our countertrend trading system proved considerably less profitable. This is because the system only attempts to benefit from mean reversion, so the amount of profit generated on a per-trade basis is significantly lower.
BENEFITS AND LIMITATIONSOne of the most obvious benefits in using mathematical technical analysis to develop mechanical trading systems is that the results generated are objective and indisputable. As a result, traders can determine both the potential risk/reward ratio and the probability of a particular trade's success based on a study of the mechanical trading system's historical performance, prior to any commitment of capital. The most serious limitation is that a purely mechanical system will be forced to endure losses that an experienced trader can often avoid. For example, following the 2003 victory of US forces in Iraq, the majority of trend-following technical indicators generated buy signals in the US dollar. However, many traders simply disregarded these signals because they represented market emotion and were in conflict with an underlying, weakened fundamental supply-and-demand picture. Within the context of its limitations, the use of mathematical technical analysis in the development of mechanical trading systems offers traders an invaluable tool in their quest for profitability.
RELATED READINGWeissman, Richard [Forthcoming]. Mechanical Trading Systems: Pairing Trader Psychology With Technical Analysis, John Wiley & Sons.
Richard Weissman is a trading consultant and faculty member at The Oxford Princeton Programme in Princeton, NJ. Based in Florida, he may be reached at rweissman@oxfordprinceton.com.
Charts courtesy of Moneyline Telerate
Current and past articles from Working Money, The Investors' Magazine, can be found at Working-Money.com.
|
| E-mail address: | rweissman@oxfordprinceton.com |
PRINT THIS ARTICLE

Request Information From Our Sponsors
- StockCharts.com, Inc.
- Candle Patterns
- Candlestick Charting Explained
- Intermarket Technical Analysis
- John Murphy on Chart Analysis
- John Murphy's Chart Pattern Recognition
- John Murphy's Market Message
- MurphyExplainsMarketAnalysis-Intermarket Analysis
- MurphyExplainsMarketAnalysis-Visual Analysis
- StockCharts.com
- Technical Analysis of the Financial Markets
- The Visual Investor
- VectorVest, Inc.
- Executive Premier Workshop
- One-Day Options Course
- OptionsPro
- Retirement Income Workshop
- Sure-Fire Trading Systems (VectorVest, Inc.)
- Trading as a Business Workshop
- VectorVest 7 EOD
- VectorVest 7 RealTime/IntraDay
- VectorVest AutoTester
- VectorVest Educational Services
- VectorVest OnLine
- VectorVest Options Analyzer
- VectorVest ProGraphics v6.0
- VectorVest ProTrader 7
- VectorVest RealTime Derby Tool
- VectorVest Simulator
- VectorVest Variator
- VectorVest Watchdog


