HOT TOPICS LIST
- Strategies
- Stocks
- Buy
- Investing
- Brokers
- Psychology
- Interviews
- Accumulate
- Sell
- Hold
- Spotlight
- Websites
- Candlestick Corner
- Gold & Metals
- Options Trading
LIST OF TOPICS
FOCUS ON
The Bulls Of 1987
12/03/03 09:55:12 AM PSTby David Penn
Two bull markets entered in 1987. Only one got out alive. Was that a lesson for today's markets?
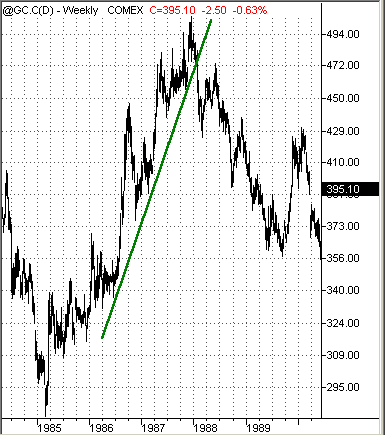
| To say that one of the bull markets that captured investor attention in 1987 "got out alive" may be a bit misleading. If you were an investor in blue-chip Dow Jones stocks in 1987, then the crash of Black Monday in October of that year was devastating. But it was also a devastatingly good buying opportunity, as the Dow Jones Industrial Average (DJIA) managed to make a new high less than two years later in the autumn of 1989 and, by 1991, never traded below the 1987 highs (full disclosure: the so-called "average" stocks represented by the Value Line Geometric Index did not regain their 1987 highs until the spring of 1994). Nevertheless, compared to the other bull market that was soaring in 1987 — the bull market in gold — stocks got off pretty lightly, especially considering what happened to gold when it finally reached its peak in December 1987 just shy of $510. By the time the Dow Jones industrials regained their 1987 highs, gold prices had fallen below $375 — a drop of some 26%. And by the end of 1991, the DJIA closed at 3169, 14% higher than its 1987 high, while gold slipped even further to $355. The rest, as they say, is history: the Dow Jones soared over the balance of the 1990s, closing 1999 at 11,497, while the gold price ended 1999 at $290 after falling as low as $253 earlier that year. What relevance do the 1987 markets in stocks and gold have for investors in December 2003? I wanted to take a closer look at the stock and gold markets of 1987 after hearing an offhand remark from Elliott wave theorist Robert Prechter in a broadcast roundtable conversation on Jim Puplava's FinancialSense.com. Prechter — in the company of a few gold bugs who saw in gold's recent three-year advance the makings of a new bull market — was trying to articulate a bearish case for gold going forward into the balance of 2003 and into 2004. The gold market in the 1980s peaked approximately two months after stocks did, and he noted that such a scenario might be a crude template for the gold and stock markets in 2003, both of which have been enjoying near-simultaneous, cyclical moves to the upside. Many observers have regarded the simultaneous rise of both stocks and gold with real astonishment and wondered whether such a bull market buddy system was ultimately a good thing for stocks. In this light, Prechter's observation about the markets of 1987 — and how two markets that were rising together eventually fell together — seemed worthy of further exploration and reflection.
THE TECHNICALS THENCompare the two markets as they entered the 1980s. The bull market in gold that began in the early 1970s reached a top, a towering panic-filled top, in January 1980 with a gold price of $873. Gold fell from these levels almost immediately afterward in a five-wave movement that first took gold down to the $463 level in the spring of 1980, then back up to $749 in the autumn; back down to $298 in June 1982; up to $520 early in 1983; and then, finally, down to a low of $283 in February 1985. In five years, gold had fallen from $873 to $283 — a collapse of over 67%. In fact, the $283 level remained the low point for gold for more than 10 years, not dropping below that level until 1998. Meanwhile in 1980, the Dow industrials was in year 5 of a bull market that began with the bear market lows of December 1974 at 570. After a largely sideways movement from 1978 to 1980, the DJIA made an intermediate bottom in March 1980 at 730 before proceeding on the now-legendary bull market run to 2746 more than seven years later.
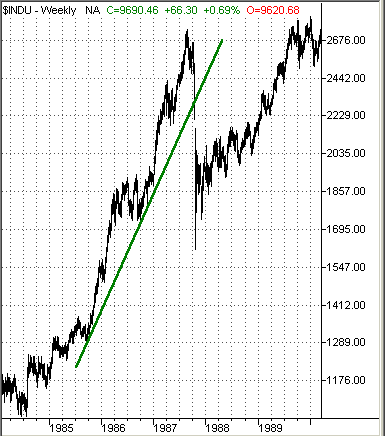
Figure 1: The gold market topped two months after the Dow Jones industrials did. If the stock and gold markets looked quite different from each other going into the early 1980s, by the middle of the decade, both stocks and gold had gotten into gear with each other. The pivotal time was between the autumn of 1985, when stocks ended a minor correction, and the spring of 1986, when gold, which had been falling steadily for years, finally bottomed. In fact, looking at the charts of the Dow Jones industrials and gold prices from 1985 through 1987, I was struck by the resemblance of the two advances. Both moved up strongly in 1985, consolidated to varying degrees during 1986 (while still, on balance, moving upward), and soared higher in 1987. How did both react as they approached the peak? Using 1985 as the low from which a trendline can be drawn, we get a good sense of both the uptrends in stocks and gold as well as the first instance in which the trends were broken. In the DJIA, the trendline from the autumn of 1985 is not broken until mid-October. This came approximately two months after prices peaked. In the case of gold, the trendline from the summer of 1986 was broken in the second half of January 1988, approximately one month after prices peaked.
Figure 2: The stock market crash in 1987 turned out to be the beginning of a brief cyclical bear market for the average stock.
Let's take a look at the context of these moves in the second half of 1987. This technical context will help in comparing the markets of 1987 with the markets of 2003. Recall that gold in 1987 was in a bear market — or cyclical — rally. The secular bull market in gold ended in 1980, and the move up during the 198587 period was "simply" a reaction to the lows that developed in the wake of the collapse of gold prices in early 1980. Stocks, as represented by the Dow Jones industrials, were in almost the opposite situation. The DJIA in 1987 was, if you will, in a cyclical bull market within a secular bull market, the secular bear market period for stocks having ended more than a decade before (some say the market bottomed in 1974; others consider 1982 to be the "official" beginning of the secular bull market). The distinction is that while both markets entered bear periods after 1987, the bearish period for stocks was considerably shorter than the bearish period for gold. This is true even if we take as our stock proxy not the Dow Jones industrials, but the Value Line Geometric Index, which, as mentioned, did not regain its 1987 highs until 1994. The reason? When stocks entered their bear period late in the autumn of 1987, it was a cyclical bear period within a larger, secular bullish period. When gold entered its bear period early in 1988, it was actually reentering its secular bear market, leaving behind what might be called a three-year "excursion" into bullishness from 1985 to 1987.
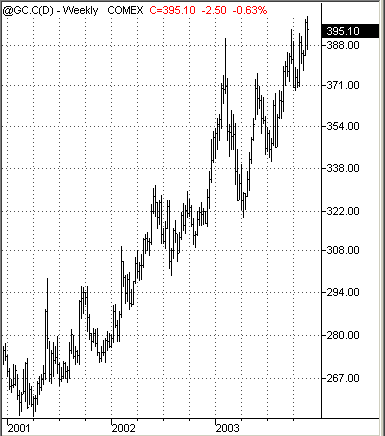
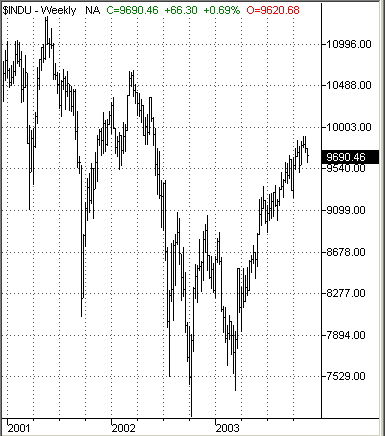
THE TECHNICALS NOWOne factor that is immediately interesting when comparing the technical portrait of gold and the DJIA in 1987 with that of gold and the DJIA in 2003 is that the two markets appear to be changing places. What was a secular bull market in stocks now appears to have given way to a secular bear market in stocks, and what was a secular bear market in gold now appears to have given way to a secular bull market in gold. This reversal is part of what makes the comparisons to the 1987 period interesting. Are stocks, after three years of a crushing bear market, en route to new highs consistent with a new bull market? Or are stocks replaying the market experience of gold in 1987, simply making a cyclical move to the upside in response to "oversold" market conditions? Similarly, is gold still just the "barbaric relic," the scourge of central bankers everywhere and, at the end of the day, far more worthwhile to the average investor as a component in jewelry than as an asset class in a responsible investment portfolio? Or is gold replaying the market experience of stocks in 1987, working its tortuous way up from bear market lows, through price spikes of exuberance and heart-stopping crashes in confidence but, nevertheless, headed toward higher and higher ground?
Figure 3: After testing its lows in 2001, gold has been in an uptrend ever since.
It is impossible to know at this point. Even as the secular bear market in gold from 1980 to 1999 and the secular bull market in stocks from 1974 to 2000 can be almost completely mapped out down to the level of the individual cyclical rallies, it may be simply ironic conjecture to posit that gold and stocks have, in a sense, swapped roles. Some market participants, however, are quite convinced that, to put it bluntly, gold will keep goin' up, and stocks will keep goin' down, and whether the two have a formal swapping arrangement is beside the point. Richard Russell, who for decades has regularly penned the Dow Theory Letters, has become one of these half-bull, half-bear creatures who is as bullish on gold as he is bearish on stocks. Russell has been particularly passionate in his advocacy for gold investment, recently opining in his newsletter that:
There are a few times in an investor's life when the opportunity for huge profits lies ahead. Such periods in the stock market occurred in 1932, 1942, 1949, 1974, and 198082. People who loaded up with common stocks at those times and held those stocks made fortunes.
Figure 4: In a bear market since early 2000, is the DJIA's recent advance in 2003 merely a bear market bounce?
For those who find it hard to imagine a bull market in gold that, like the bull market in stocks, would take gold prices "higher than anyone thinks possible," recall that these were exactly the same "It can't happen here" sentiments that most investors had with regard to stocks back in the late 1970s and early 1980s. Reading through old copies of financial magazines from the period is an eye-opening reintroduction to how bull markets really do climb a "wall of worry." Consider the following quotes and observations from Commodities magazine, circa January and February 1982:
Economists predict a mild economic recovery in the first half of 1982, but no boom is coming. What is especially significant about this version of the "1987 double-analog" model is that it doesn't just provide caution for stock market bulls who, in 2003, could be setting themselves up for a 1988-style gold-market crash and the resumption of the old secular bear market trend, but it also gives some reason for mild anxiety for gold bulls — who have become positively frothy over the comeback of the yellow metal. Would gold bulls remain bulls if the price of gold peaked at $400 or $425, then suddenly in one week dropped by 20%, 30%, or more? Despite the admonitions of long-term market watchers like Richard Russell, who warn potential gold investors that they need to consider long-term investment returns as opposed to short-term "trading" returns, the exuberance of a gold price above $400 in the immediate future would be outdone only by the despair of a sudden reversal to the downside that lowered the price of gold to $300 or $250 or lower — even if this ultimately turned out to be just an opportunity to, as Russell recently advised his subscribers, "pull the trigger" on gold.
David Penn may be reached at DPenn@Traders.com.
SUGGESTED READINGAbbott, Susan [1982]. "What Path Will Economy Take In 1980s?" Commodities: February.
Charts courtesy of TradeStation
Current and past articles from Working Money, The Investors' Magazine, can be found at Working-Money.com.
|
Technical Writer for Technical Analysis of STOCKS & COMMODITIES magazine, Working-Money.com, and Traders.com Advantage.
| Title: | Traders.com Technical Writer |
| Company: | Technical Analysis, Inc. |
| Address: | 4757 California Avenue SW |
| Seattle, WA 98116 | |
| Phone # for sales: | 206 938 0570 |
| Fax: | 206 938 1307 |
| Website: | www.traders.com |
| E-mail address: | DPenn@traders.com |
Traders' Resource Links | |
| Charting the Stock Market: The Wyckoff Method -- Books | |
| Working-Money.com -- Online Trading Services | |
| Traders.com Advantage -- Online Trading Services | |
| Technical Analysis of Stocks & Commodities -- Publications and Newsletters | |
| Working Money, at Working-Money.com -- Publications and Newsletters | |
| Traders.com Advantage -- Publications and Newsletters | |
| Professional Traders Starter Kit -- Software | |
PRINT THIS ARTICLE

Request Information From Our Sponsors
- VectorVest, Inc.
- Executive Premier Workshop
- One-Day Options Course
- OptionsPro
- Retirement Income Workshop
- Sure-Fire Trading Systems (VectorVest, Inc.)
- Trading as a Business Workshop
- VectorVest 7 EOD
- VectorVest 7 RealTime/IntraDay
- VectorVest AutoTester
- VectorVest Educational Services
- VectorVest OnLine
- VectorVest Options Analyzer
- VectorVest ProGraphics v6.0
- VectorVest ProTrader 7
- VectorVest RealTime Derby Tool
- VectorVest Simulator
- VectorVest Variator
- VectorVest Watchdog
- StockCharts.com, Inc.
- Candle Patterns
- Candlestick Charting Explained
- Intermarket Technical Analysis
- John Murphy on Chart Analysis
- John Murphy's Chart Pattern Recognition
- John Murphy's Market Message
- MurphyExplainsMarketAnalysis-Intermarket Analysis
- MurphyExplainsMarketAnalysis-Visual Analysis
- StockCharts.com
- Technical Analysis of the Financial Markets
- The Visual Investor


