HOT TOPICS LIST
- Strategies
- Stocks
- Buy
- Investing
- Brokers
- Psychology
- Interviews
- Accumulate
- Sell
- Hold
- Spotlight
- Websites
- Candlestick Corner
- Gold & Metals
- Options Trading
LIST OF TOPICS
TRADER'S NOTEBOOK
A Developing Depression
12/31/03 02:36:33 PM PSTby Robert R. Prechter & Peter Kendall
. . . Not a new boom.
| Four years ago, as US stock indexes reached their all-time highs, The Wall Street Journal observed, "Economists are downright euphoric." Of 54 economists surveyed at that time, all but two were bullish for 2000. One year later, when the Dow Jones Industrial Average (DJIA), Standard & Poor's 500, and Nasdaq were down 8%, 15%, and 51% from their respective highs and the onset of recession was just weeks away, economists were even more united in their expectation of continued growth. Only one economist out of 54 surveyed called for a recession in 2001. In January 2002, the bullish verdict was unanimous. Not one of the 55 economists surveyed for The Wall Street Journal's 2002 forecast expected the contraction to develop into a serious decline. The S&P collapsed again, from there into October. In January 2003, all but one economist surveyed was bullish. Last year, they lucked out, as the economy underwent the weakest recovery on record. What are economists saying today? Need you ask? According to BusinessWeek's 2004 outlook, 60 out of 60 economists expect growth of at least 2.9% in 2004. Official pronouncements suggest that they are more bullish than ever. On December 11, 2003, the Conference Board announced that it was "revising its year-end economic forecast sharply upward," announcing that "2004 will be the US's best year economically in the last 20 years." The Treasury, the Business Council of CEOs, and Federal Reserve chairman Alan Greenspan have all endorsed this outlook, as demonstrated by this WSJ headline: "Greenspan sees job boom, calls productivity 'startling.'" Further, the Journal reports that even industrial firms are "starting to see reason for optimism." Not only that, "2004 promises to be a year when everybody wins," boasts BusinessWeek's forecast. Investment advisors and the individual investors agree. The American Association of Individual Investors' weekly survey shows that individuals are nearly as bullish in late 2003 as they were at the DJIA's all-time high in January 2000. A majority have been bullish on stocks for 18 straight weeks, which is seven weeks longer than the prior record of 11 that coincided with the all-time high in the DJIA. According to Investors Intelligence, the bullish majority among investment advisors has lasted even longer. At 32 straight weeks, the bullish advisory consensus is the longest in the 40-year history of the Investors Intelligence survey. Is this shared optimism a wise stance, or is the unanimous projection of an economic boom an erroneous assumption that will devastate committed portfolios, leveraged corporations, unwary creditors, and unprepared local governments?
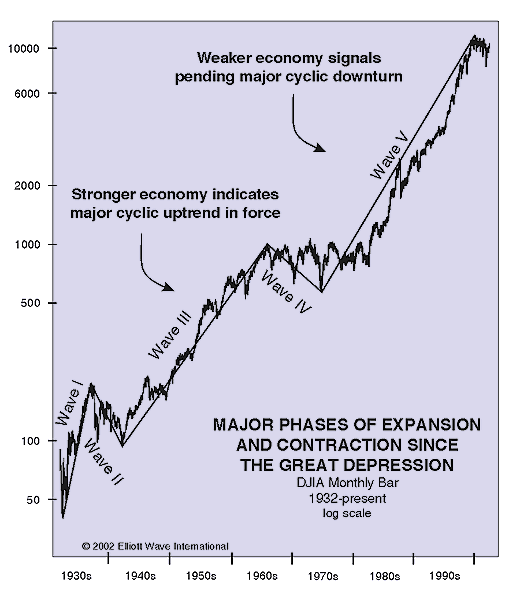
ECONOMIC INDICATORSThe most revealing answer may be found in a place no one else is looking: long-term economic trends. Comparative measures of economic performance can provide valuable clues to changes in the economy's trend. This is especially true of long-term trends, where fundamental improvements or problems in the economy cannot help but express themselves. Economic trends roughly track stock market trends, usually with a multimonth lag. Since the bottom in stocks associated with the Great Depression, there have been three major phases of stock-price advance in the United States. The first and briefest lasted from 1932 until 1937 and was the initial recovery out of the Depression. The second began in 1942 and lasted until 1966. The third began in late 1974 and lasted until 2000. We refer to these three expansionary phases and their two countertrend interruptions as periods I through V, as illustrated in Figure 1.
Figure 1: The three major stock market growth phases since the Great Depression. This article contrasts the economic health of the two great post-Depression bull markets, periods III and V. Roughly, these labels refer to the 1950s through 1960s and the 1980s through 1990s, respectively. Periods III and V are similar in some ways. For instance, each one involved a persistent bull market in stocks that lasted about a quarter of a century. However, it is their differences that are telling. We have often heard that the latter period was the greatest American economic boom ever, but statistics show the extent to which the economic vigor of period V clearly failed to measure up to that of period III. Once we have established that difference, we will explore its implications.
Comparative Measures of Economic Health
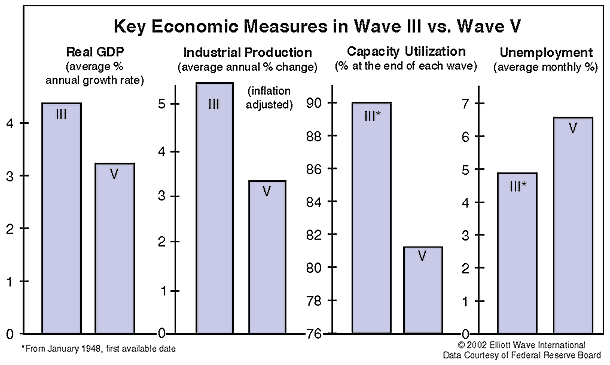
In period III, from 1942 to 1966, the annual real GDP growth rate was better than 4.3% per year. In period V, from 1982 through 1999, it was only 3.2%.
Figure 2: Comparative measures of economic health. Here you see the measures of GDP, industrial production, capacity utilization, and the unemployment rate during period III vs. period V.
Industrial Production
Capacity Utilization
Unemployment Rate
Comparative Measures of Debt, Deficits, and Liquidity
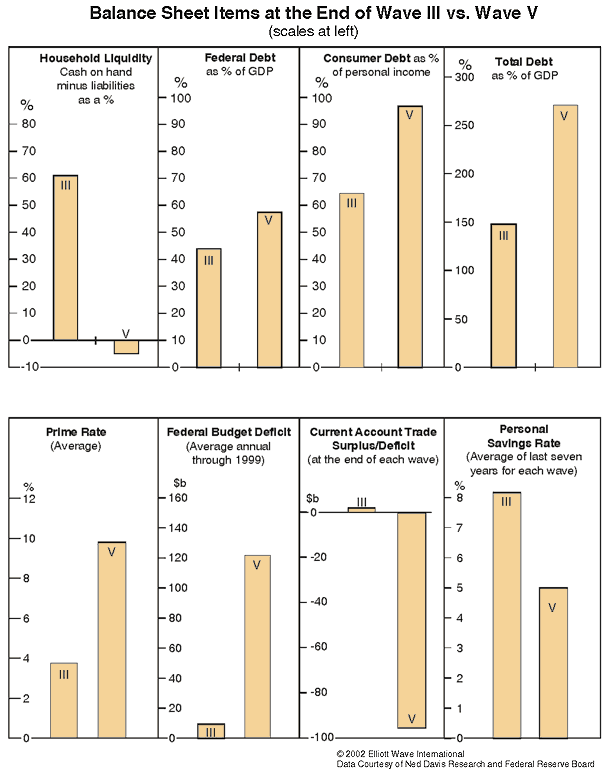
Figure 3: Comparative measures of debt, deficits, and liquidity. Households' Liquid Assets
Consumer Debt
Total Debt as a Percentage of GDP
Prime Rate
Federal Budget Deficit
Current Account Trade Figures
Personal Savings Rate
US Balance Sheet
Economic Deterioration During the Final Years of Period V The economic expansion waned within period V as well. Real GDP growth was 20% less in the 1990s than it was in the 1980s. Within the 1990s themselves, the same slowing is evident. From the second quarter of 1994 through the second quarter of 1998, year-to-year corporate profit growth peaked at 28% and averaged 13.6%. From the fourth quarter of 1998 through the third quarter of 2001, profit growth peaked at 12.8% and averaged 4.5%, both dramatically lower figures. These comparisons show that the economic expansion in the US had been slowing at multiple degrees of scale going into the contraction that began in 2001. The extent and persistence of this slowing portends a reversal of commensurate significance.
FORECASTING THE DIFFERENCEThe wave principle model of stock market behavior proposes that bull markets of all degrees progress in five waves. The idea that there is a difference between the economic performance manifest in a third wave and those that manifest in a fifth wave has been a part of the wave theory for more than 20 years. The book Elliott Wave Principle (1978) describes third waves as "wonders to behold," as they bring about "increasingly favorable fundamentals." In contrast, "the fifth of the fifth [wave] will lack the dynamism that preceded it." By labeling the 1942 to 1966 bull market as "wave III," wave analysts established the economic growth rate of the 1950s and 1960s as a standard that the next bull market would not surpass. In an August 1983 report on the developing "Super Bull Market," our publication, The Elliott Wave Theorist, reiterated the expected relationship between the two periods, adding, "This fifth wave will be built more on unfounded hopes than on soundly improving fundamentals such as the US experienced in the 1950s and early 1960s." These observations came years ahead of the data reported here for period V. We believe our firm was able to anticipate the difference because we understood the dynamics that produced it. We also see this difference between periods III and V as vitally important because long-term uptrends always decelerate before they reverse. That's why the largest economic contractions always follow major fifth waves. We need not, however, rely on hypothesis alone. Recent history provides two great precursors to the current situation.
THE US IN THE 1920SFrom 1897 through 1920, the annual inflation-adjusted Gross National Product in the US rose from $150 billion to $900 billion (expressed in 1939 dollars). That's a six-times multiple in 24 years, despite the fact that over half of those years sported recessions. From 1921 through 1929, during the Roaring 1920s, GNP rose from $720 billion to $1.1 trillion, a mere 0.5-times multiple in nine years — a miserable relative performance. In the face of this slowdown, the stock market nevertheless produced a greater percentage gain in eight years than it had done in the entire preceding two dozen years. Much like today, the economy in the period V of that time failed to keep pace with the roaring advance in stock prices — and it underperformed the prior expansion. The aftermath was the Great Depression.
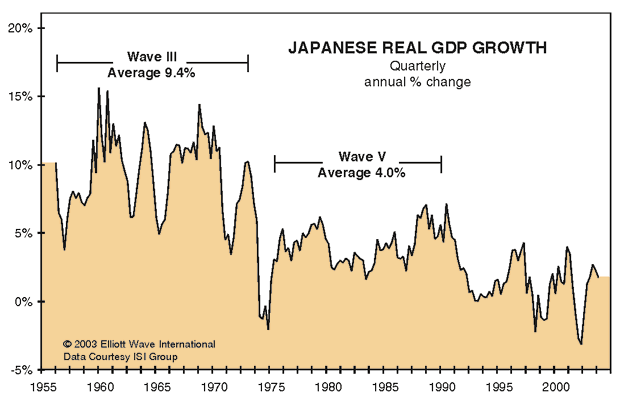
THE JAPANESE EXPERIENCEThe Japanese experience of the past half century reflects the thesis presented here. Figure 4 shows real GDP growth in Japan from 1955 to the present. Japan's growth during 195573 was extremely powerful, averaging 9.4% per year. Its growth from 1975 through 1989, which sported a record-breaking stock market boom, averaged only 4% per year. The relatively poor economic performance during that boom signaled an approaching reversal of multidecade importance in both stock prices and the economy. The extent of the divergence portended such a large economic contraction that Japan's decline cannot yet have ended. The process has been long and slow because most of the rest of the world's economies continued their investment manias and economic growth, allowing vigorous trade to provide support during the first decade of Japan's economic decline.
Figure 4: Real GDP growth in Japan (1955 - present). Although the timing of the Japanese experience has been different from that in the US, the sequence and juxtaposition of stock and economic events are so far the same, implying that the outcome will be similar as well. If there is to be a difference, it will be that the American economic contraction will be far swifter. With many of the rest of the world's economies also at risk of faltering, the US lacks a group of healthy trading partners with which to mitigate the speed of its contraction. Bear market rallies in the Nikkei have led to brief, one-quarter increases in year-to-year real GDP growth in Japan (to 4.7% or better) in March 1991, December 1996, and March 2000. The San Francisco Chronicle recorded in March 1991 that during the first such bounce, the "entire policy establishment [congratulated] itself for being the first regulators in history to deflate an asset bubble without impacting severely on economic activity." Yet after each brief recovery, the market headed for new lows and the economy followed. The US has just experienced a similar, flashy "bounce," and now lows are likewise due to follow.
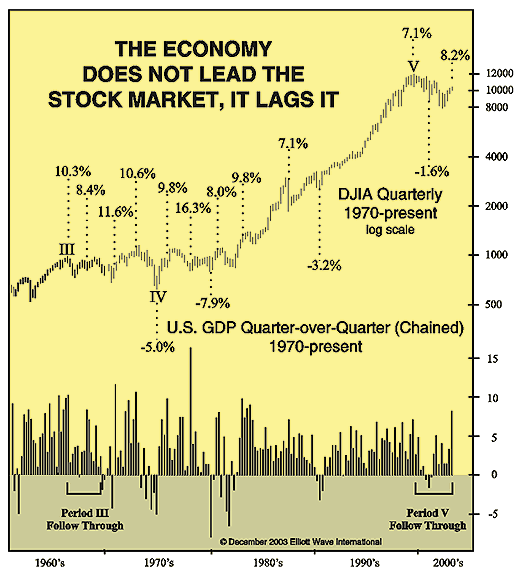
THE ECONOMY FOLLOWS STOCKSBy placing the quarterly performance of the DJIA over quarterly GDP growth, Figure 5 reveals the economy's perpetual losing effort to catch up to stock prices. All of the biggest declines in GDP shown were registered after multiquarter declines in the DJIA, and many of the biggest quarterly expansions came at the end of stock-market rallies.
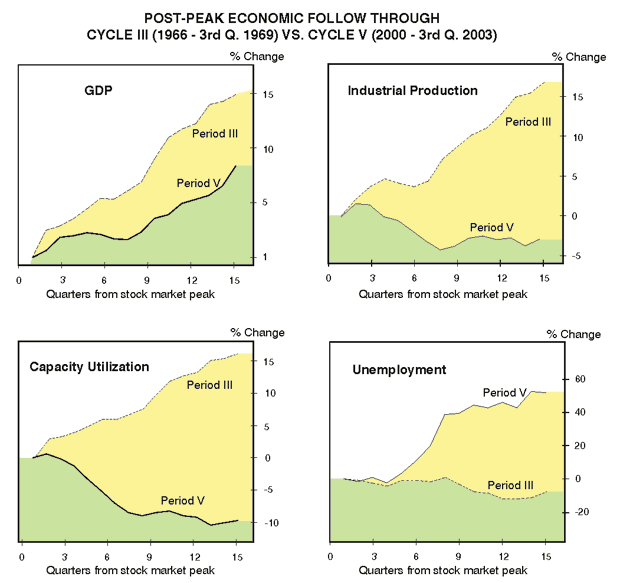
Figure 5: Quarterly performance of DJIA vs. quarterly GDP growth. WEAKER FOLLOW-THROUGHLonger-term stock market moves have a residual effect that can influence economic performance for several quarters. Figure 6 depicts the follow-through for periods III and V. The relative weakness of period V is readily apparent. In the 15 quarters since the DJIA's all-time peak, real GDP has grown at a 2.3% annual rate, far slower than the average of 3.7% in the 15 quarters that followed period III. For all other key economic measures, the disparity is even greater. Industrial production and capacity utilization rose after period III and have fallen since 2000. Unemployment fell after period III and has risen since 2000. This keeps cycle V's "comparatively lackluster" track record intact, and intensifies the message of the fundamentals: the economy is far weaker than virtually anyone realizes.
Figure 6: Follow-through for periods III and V.
The follow-through period has just about run out of time. After the follow-through comes the retrenchment. That is what the US economy faces today.
THE DEVELOPING CONTRACTIONHow deep will the contraction ultimately become? We believe the answer lies in the great imbalance between today's sky-high expectations and historically high stock prices on one hand, and the disparate economic performance between periods III and V on the other. The termination of period III led to a string of four recessions between 1970 and 1982. The current contraction began from a weaker economic background than that of the 1950s and 1960s, despite over two decades of stock gains that falsely implied a better economy. Because this weaker background is typical of major fifth waves, and because we have precedents against which to evaluate such divergent behavior, we conclude that the next economic contraction in the US will be more severe than any of the contractions following period III. In fact, it will be no less relentless or acute than the contraction of the 1930s or the as-yet unfinished retrenchment that began in Japan over a decade ago. When historians review this time period, we suspect that they will see the persistent regression in growth over the decades in the latter half of the 20th century and wonder why so few recognized it as a signal of the coming change.
SUGGESTED READINGConference Board: www.conference-board.orgElliott Wave International: www.elliottwave.com Frost, A.J., and Robert Prechter [1985]. Elliott Wave Principle, New Classics Library. Hartle, Thom [1996]. "At The Crest Of The Tidal Wave: Robert R. Prechter Jr. On The Elliott Wave Principle," interview, Technical Analysis of Stocks & Commodities, Volume 14: January. Prechter, Robert R., Jr. [2002]. Market Analysis For The New Millennium, New Classics Library. _____ [2002]. Conquer the Crash: You Can Survive And Prosper In A Deflationary Depression, John Wiley & Sons. _____ [1999]. The Wave Principle Of Human Social Behavior, New Classics Library. _____ [1995]. At the Crest of the Tidal Wave, New Classics Library. _____, ed. [1994]. R.N. Elliott's Masterworks: The Definitive Collection, New Classics Library.
Current and past articles from Working Money, The Investors' Magazine, can be found at Working-Money.com.
|
| Company: | Elliott Wave International |
| Website: | www.elliottwave.com |
Traders' Resource Links | |
| The Elliott Wave Short Term Update -- Advisory Services | |
| Daily Futures Junctures -- Advisory Services | |
| The European Short Term Update -- Advisory Services | |
| Elliott Wave Principle -- Books | |
| At the Crest of the Tidal Wave -- Books | |
| Socionomics -- Books | |
| Prechter's Perspective -- Books | |
| Conquer the Crash -- Books | |
| View From The Top of the Grand Supercycle -- Books | |
| Beautiful Pictures -- Books | |
| Monthly Futures Junctures -- Publications and Newsletters | |
| The Elliott Wave Financial Forecast -- Publications and Newsletters | |
| The Elliott Wave Short Term Update -- Publications and Newsletters | |
| Daily Futures Junctures -- Publications and Newsletters | |
| The Elliott Wave Theorist -- Publications and Newsletters | |
| European Financial Forecast -- Publications and Newsletters | |
| The European Short Term Update -- Publications and Newsletters | |
| The European Financial Forecast -- Publications and Newsletters | |
PRINT THIS ARTICLE

Request Information From Our Sponsors
- StockCharts.com, Inc.
- Candle Patterns
- Candlestick Charting Explained
- Intermarket Technical Analysis
- John Murphy on Chart Analysis
- John Murphy's Chart Pattern Recognition
- John Murphy's Market Message
- MurphyExplainsMarketAnalysis-Intermarket Analysis
- MurphyExplainsMarketAnalysis-Visual Analysis
- StockCharts.com
- Technical Analysis of the Financial Markets
- The Visual Investor
- VectorVest, Inc.
- Executive Premier Workshop
- One-Day Options Course
- OptionsPro
- Retirement Income Workshop
- Sure-Fire Trading Systems (VectorVest, Inc.)
- Trading as a Business Workshop
- VectorVest 7 EOD
- VectorVest 7 RealTime/IntraDay
- VectorVest AutoTester
- VectorVest Educational Services
- VectorVest OnLine
- VectorVest Options Analyzer
- VectorVest ProGraphics v6.0
- VectorVest ProTrader 7
- VectorVest RealTime Derby Tool
- VectorVest Simulator
- VectorVest Variator
- VectorVest Watchdog

