HOT TOPICS LIST
- Strategies
- Stocks
- Buy
- Investing
- Brokers
- Psychology
- Interviews
- Accumulate
- Sell
- Hold
- Spotlight
- Websites
- Candlestick Corner
- Gold & Metals
- Options Trading
LIST OF TOPICS
TRADER'S NOTEBOOK
Trading Pullbacks In Trends
02/04/04 04:21:03 PM PSTby Steven Palmquist
Test the systems in your trading toolbox, and make sure you are using the right ones for current market conditions.
| Developing a single trading technique and using it all the time is like using a screwdriver even when you really need a chisel instead. Just as a carpenter has different tools for different tasks pertaining to his job, the successful trader needs a set of tools for dealing with varying market conditions. Having the proper tools and knowing when to use them will help any trader trade more successfully.
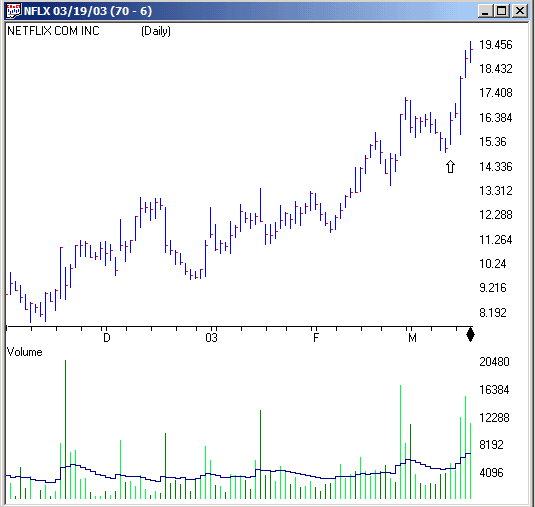
TOOLS OF THE TRADEOne of the tools that should be in the trader's toolbox is a good system for trading pullbacks in trending stocks. Since the market does not trend all the time, you also need a way to determine when it is appropriate to use this tool and when it is best to use something else. Backtesting can yield insight into when to use this approach and when to remain in cash, as well as help determine what types of pullbacks and filters are most profitable. Backtesting can provide answers to questions such as: How does volume on the pullback affect results? How does volume on the breakout day affect the profitability of your system? In what market conditions should the pullback technique be used? Knowing the answers to these questions can make you a more effective trader and lessen your risk. One of the techniques I use for trading pullbacks is to look for stocks that have been in an established uptrend but then pulled back with at least three consecutive lower highs. Figure 1 shows a chart of NFLX that illustrates an example of a pullback trading pattern in early March 2003.
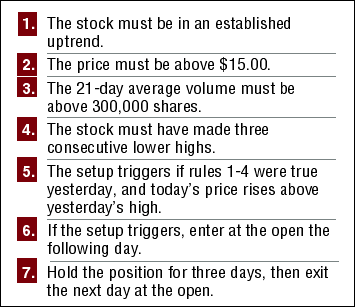
Figure 1: Trading pullbacks. NFLX established an uptrend, then pulled back with at least three consecutive lower highs. NFLX was in an established uptrend from November 2002 to March 2003. In early March, it showed a pullback of three lower highs. The following day, NFLX broke the previous day's high, ending the pullback pattern and providing an entry point or trigger. After the trigger, NFLX moved up 23% in four days. It's easy to find examples that would work for any system, which is why it is so important for traders to carefully research and test a system prior to actually using it. The first step is to clearly define the system so that it can be tested and evaluated. The rules for the pullback system can be found in Figure 2. The entry and exit rules are simple and do not require you to be glued to the screen all day. Stocks are deemed to be in an uptrend if they closed above the 200-day simple moving average, and the 20-day slopes of the 28-, 50-, and 20-day simple moving averages were positive.
Figure 2: Pullback trading system rules.
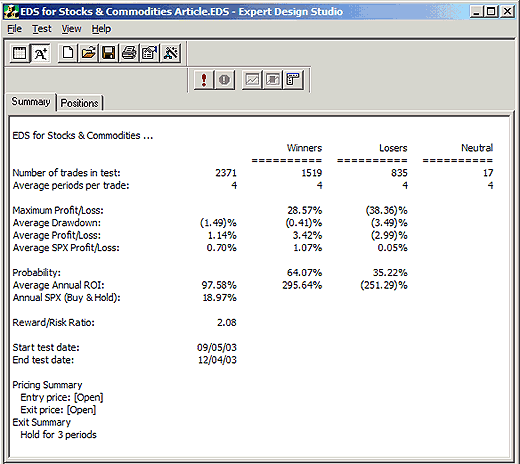
BACKTESTINGWhen evaluating a system, I first test it during a market environment wherein it should work. If it doesn't show promising results in favorable conditions, it's best to try another idea. If it shows promise in a favorable market, I will then test it under a number of different conditions and time periods. Figure 3 shows the backtesting results for the three-day pullback system during the three-month bullish period of September 5, 2003, through December 4, 2003.
Figure 3: Backtesting results for the three-day pullback scan.
In order for me to consider using a trading system, it must meet three criteria:
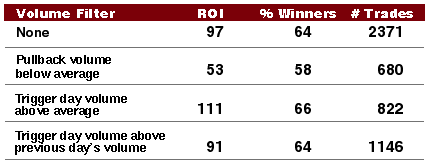
A system meeting these criteria has a positive expectancy. Trading is a game of probabilities. If I win more than I lose, and earn more on the winners than I lose on the losers, then my job is to play the game often. If we flip a coin and every time it comes up heads you give me $1, and when it comes up tails I give you $0.95, my goal is to get you to play as long as possible. The coin may come up tails a number of times in a row, but I know that over the long run I will come out ahead. Figure 3 shows that during the test period the three-day pullback system has a positive expectancy. It yields winning trades 64% of the time, and the average profit of winning trades is larger than the average loss of losing trades. The average annual return on investment (ROI) number is interesting, but since it assumes the trader takes all 2,371 trades and does not account for position sizing, it is not reflective of actual practice. The ROI number is a good figure of merit, and winning 64% of the time in a good market will keep the wolf from your door. In order to test the effects of volume considerations on the three-day pullback scan, I ran the backtest again during the same period of September 5, 2003, through December 4, 2003. This time three different volume filters were used, one at a time. The results in Figure 4 indicate that during this time period the trading results might be improved by focusing on entering positions where the volume on the trigger day is above average.
Figure 4: Results of volume filters for the pullback scan. USING FILTERSAfter evaluating the volume filters, I tested the effects of filters that use the closing price of the trigger day. Adding requirements to the three-day pullback scan (such as requiring the closing price on the trigger day to be above the previous day's close, above the previous day's low, or above the previous day's high) did not significantly improve the results. The stochastic indicator compares the current closing price to the price range of the past 21 days and expresses the ratio as a percentage. It is often used in a nontrending market to indicate when prices are overbought (stochastic above 80%) or oversold (stochastic below 20%). The three-day pullback scan looks for pullbacks in a trending market, but the stochastic indicator can be useful as a tool to measure the depth of the pullback. Adding a filter to the basic scan that requires the stochastic indicator to be less than 70 will filter out shallow pullbacks. Adding this filter to the three-day pullback scan increased the ROI to 126 and the percentage of winners to nearly 68%. Some traders use the moving average convergence/divergence (MACD) oscillator to help time their trades. The MACD oscillator is a sensitive, short-term momentum indicator. When the MACD oscillator and price are both increasing, momentum is increasing. When MACD reverses direction, it can be a warning that price action is stalling. However, since a stock meeting the requirements of the pullback scan has already seen the price action stall, you would not expect the MACD to be very helpful. Once again, I backtested the three-day pullback scan with the addition of a filter requiring the MACD oscillator to be positive on the trigger day. This significantly reduced the performance of the system. This demonstrates that it is important to test the effects of filters on a specific system, and not just add in favorite indicators without data to support their use. Always test your assumptions prior to placing real money at risk.
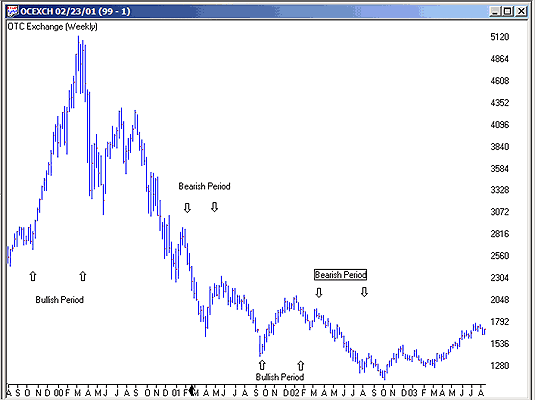
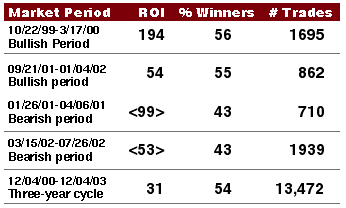
SYSTEM RESULTSThe initial testing of the three-day pullback scan showed promising results. In practice, trading candidates can be found using commercial scanning software or by glancing at charts. The initial testing indicates that traders should look for strong volume on the trigger day and consider avoiding shallow pullbacks. Some traders will look for a promising system that backtests well over a multiyear period, and then trade it. However, since market conditions change and few systems work in all market conditions, you may experience significant drawdowns when your chosen system is out of step with the market. One way to minimize drawdowns is to test your system in different markets, then develop rules on when to take the trades offered by the system and when to ignore them. Figure 5 shows two bullish and two bearish periods in the Nasdaq. Testing the three-day pullback scan during these periods yielded the results shown in Figure 6. The data indicates that the system produces good returns during bullish periods in the market, and loses money during bearish periods. The system also demonstrated profitability during the three-year period of December 4, 2000, through December 4, 2003, which included one of the worst bear markets on record. I like to see a system retain profitability during a period including bull and bear cycles.
Figure 5: Bullish and bearish testing periods in the Nasdaq. Trading with the market is a key component of trading success. Taking long positions in a market that is trending down is like swimming upstream; it can be done, but it's harder than going with the current. I make good use of trendlines and other filters to determine when to follow and when to ignore signals from my system. This approach can have a significant impact on your bottom line. One of the filters I use is the 35-day simple moving average of the Nasdaq. I use the QQQ as a proxy for the market when backtesting. Restricting entries of the three-day pullback scan to periods when QQQ is above its 35- day average improved the ROI during the three-year test period (December 4, 2000 - December 4, 2003) from the 31% shown in Figure 6 to 53%. The percentage of winning trades increased to more than 56%. Using a moving average for timing keeps you out during significant market declines, but does not get you in quick enough to trade during bear market rallies. In addition to these techniques, I use support/resistance and trendlines on the Nasdaq to decide when to take pullback trades. I use the Nasdaq for timing because it often leads the way on both the up- and downside. If the Nasdaq is channeling up, I focus on taking pullback trades when the index is bouncing off the lower trendline. If Nasdaq has been trending down, I will start taking pullback trades when the trendline is broken to the upside. This approach takes a little practice, but it can be very effective. I have used the approach outlined here to evaluate a number of trading systems. In this way, I continue to add tools to my toolbox for use in different market conditions, and am rarely without an interesting list of trading candidates.
Steve Palmquist is a full-time trader with nearly 20 years of experience. He is the founder of www.Daisydogger.com, which provides free market analysis, trading tips, and educational material, including the Timely Trades newsletter. If you are interested in the code for the trading systems mentioned here, please email Palmquist at code@daisydogger.com. Charts courtesy of AIQ Charts
Current and past articles from Working Money, The Investors' Magazine, can be found at Working-Money.com. |
| Website: | www.daisydogger.com |
PRINT THIS ARTICLE

Request Information From Our Sponsors
- StockCharts.com, Inc.
- Candle Patterns
- Candlestick Charting Explained
- Intermarket Technical Analysis
- John Murphy on Chart Analysis
- John Murphy's Chart Pattern Recognition
- John Murphy's Market Message
- MurphyExplainsMarketAnalysis-Intermarket Analysis
- MurphyExplainsMarketAnalysis-Visual Analysis
- StockCharts.com
- Technical Analysis of the Financial Markets
- The Visual Investor
- VectorVest, Inc.
- Executive Premier Workshop
- One-Day Options Course
- OptionsPro
- Retirement Income Workshop
- Sure-Fire Trading Systems (VectorVest, Inc.)
- Trading as a Business Workshop
- VectorVest 7 EOD
- VectorVest 7 RealTime/IntraDay
- VectorVest AutoTester
- VectorVest Educational Services
- VectorVest OnLine
- VectorVest Options Analyzer
- VectorVest ProGraphics v6.0
- VectorVest ProTrader 7
- VectorVest RealTime Derby Tool
- VectorVest Simulator
- VectorVest Variator
- VectorVest Watchdog

