HOT TOPICS LIST
- Strategies
- Stocks
- Buy
- Investing
- Brokers
- Psychology
- Interviews
- Accumulate
- Sell
- Hold
- Spotlight
- Websites
- Candlestick Corner
- Gold & Metals
- Options Trading
LIST OF TOPICS
DOW THEORY
The Coming Confirmation?
02/04/04 04:18:41 PM PSTby David Penn
A major Dow theory showdown looms as the averages test the March 2002 highs.
| Although there is a great deal to Dow theory that is often not appropriately ascribed to it (market prices discounting all available news, the impossibility of market manipulation over the long term, and more), one of the most famous tenets or observations of Dow theory has to do with the relationship between the industrial and transportation (formerly rail) averages. Namely, this observation holds that for any market move to be significant and long-lasting, the two main Dow averages must confirm each other. In short, as the industrials make a new high or low, so must the transports. Two of Dow theory's modern interpreters, Robert D. Edwards and John Magee, report in their seminal book, Technical Analysis Of Stock Trends, that "the averages must confirm":
This is the most often questioned and the most difficult to rationalize of all the Dow principles. Yet it has stood the test of time; the fact that it has "worked" is not disputed by any who have carefully examined the records. Those who have disregarded it in practice have, more often than not, had occasion to regret their apostasy. What it means is that no valid signal of a change in trend can be produced by the action of one average alone. It is important to recognize what this says — and what it does not say. Often, an overeager interpreter of Dow theory will attempt to reason that, in a declining market, if one average makes a lower low and the other average does not, it shows that both averages are weak. Or conversely, that the lower low on the one average was not confirmed by the higher low on the other average and thus both averages are likely to move higher. This is not the correct interpretation. What Edwards and Magee insist is that in the event that the averages do not confirm, then the current or prevailing trend — generally referred to as the primary trend — should be considered to be still in effect until both averages, by confirming each other's action, prove otherwise. Without the confirmation of both, as Edwards and Magee noted, "at best, the direction of the primary trend is still in doubt."
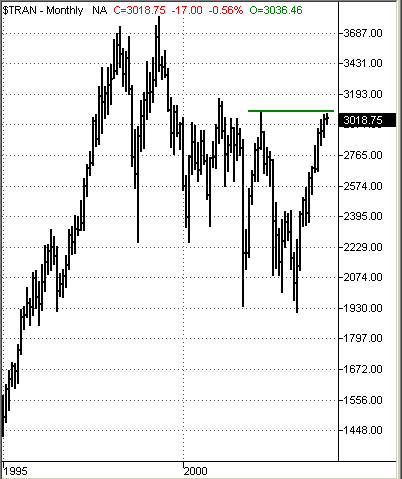
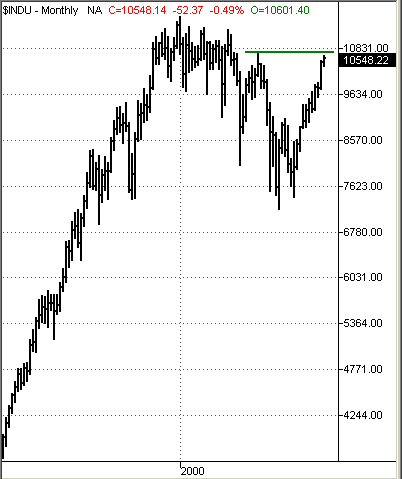
A MARCH TO REMEMBERI found myself thinking about Dow theory after looking at weekly charts of the Dow industrials and Dow transports recently. Both averages have, as of mid-January 2004, been in significant bull markets — the industrials' lasting from October 2002 bottom and the transports' originating from the March 2003 bottom. Both markets ended 2003 with new highs for the year, which sets up a major test of the highs of 2002. Investors, traders, and analysts will not have to wait long, either. The industrials' weekly close at 10,600 is less than 75 points away from their 2002 high, made on March 22 at 10,673, and the transports' recent weekly close at 3036 is a mere 15 points away from their 2002 high of 3051, registered on March 8. The psychological implications of this test are as significant as any, since these bull markets — or bear-market rallies, if you prefer — began. These March highs represent the extent to which the previous great bear market rally, the post-September 11, 2001, "war rally," advanced — some 32% over six months in the industrials and about 57% over the same period in the transports. This, incidentally, compares to 47% over the 15 months since the October 2002 bottom in the industrials and 58% over the 10 months since the March 2003 bottom in the transports. One of the strongest signals in a bull market comes when prices reach a previous peak, exceed that peak, then follow through with further price action to the upside. This is what technicians refer to as a "failed top test": The top was tested by advancing prices and it did not hold. Market sentiment — which Dow theorists like George Schaefer thought was especially important — remains very strong, even as both averages appear to be technically overbought. Schaefer, speaking broadly about such scenarios, wrote:
. . . Our new Dow theory allows the crowd to get as emotional in its selling or buying as it will — with no restrictions whatever on the duration or extent of the secondary or intermediate trend. In primary bull markets, when things get scary, we simply wait for the fearful to sell out, then we assume that the main primary trend will resume as expected. In primary bear markets, just the opposite is true.
Figure 1: Monthly Dow industrials. Will the Dow make a new high in this bull market move off the October 2002 lows? The March 2002 highs loom as significant resistance.
Thus, the trend in sentiment — like the trend in the averages themselves — is upward and, like the primary trend in Schaefer's formulation, is likely to continue upward. So it is likely that both the industrials and the transports will in fact trade above their March 2002 highs. However, a "nonconfirmation" in which the transports, for example, had a closing high above the 3051 level while the industrials failed to close above the 10,673 level would mean only that the prevailing trend was in doubt. It would not necessarily mean that the averages were about to collapse, nor that the average that had taken out the March 2002 would "lead" the other average higher. All it would mean is that the trend (and I would consider this to be an intermediate or secondary bullish trend, in Dow theory parlance, within a primary bear market) is somewhat in doubt. Until the other average — transports or industrials — confirms, investors and traders who decide to participate in the market should continue to view the market just as they had before the "nonconfirmation" (in this case, still bullish, still moving higher, still long).
BRING ON THE BULLS?In concert with other technical analysis tools, Dow theory is every bit as valuable a method for understanding the movement of stock prices as it ever was. Part of the current bullish case on stocks is predicated on simple chart patterns — namely, the triple bottom and head & shoulders bottoms traced out in most of the major market averages and indexes (the Standard & Poor's 500, Nasdaq, Dow industrials, and Dow transports).
Figure 2: Monthly Dow transports. Having retraced the entirety of their decline from the March 2002 highs, the Dow transports are closing in on their highest mark in more than three years.
With regard to the Dow averages, it is interesting to note that the Dow transports have already surpassed the projection based on their triple-bottom formation from the summer of 2002 until the breakout in the spring of 2003. The projected minimum move (using either Stan Weinstein's swing rule or the methods outlined by Thomas Bulkowski in his Encyclopedia Of Chart Patterns) in the transports was to about 3022, and the projected minimum move for the industrials is close to 10,957. This strongly underscores the bullish argument, particularly with regard to the blue chips of the Dow industrials — though it should be mentioned that the Dow transports have only recently arrived at their minimum projection. The triple-bottom formation in the Nasdaq was exceptionally modest in size, projecting a minimum move to 1934 that the Nasdaq was able to best in early November 2003. The Standard & Poor's 500's triple bottom projected a minimum move to 1161, a level less than 30 points away from the S&P 500's February 2002 levels. In this way, the Nasdaq and the transports appear to have moved most quickly in response to their breakouts, while the Dow industrials and S&P 500 have lagged somewhat. Writing on his website, Richard Russell (author of the long-running Dow Theory Letters) observed that "the number of people who hold stocks from the beginning to the end of a bull market can probably be counted in the hundreds." This is likely as true for secondary and intermediate bull markets as it is for primary bull markets. While it is always a good idea to, as the saying goes, "take something off the table" (in other words, don't forget to sell), it is also a good idea to avoid leaving the table altogether until you are sure there is nothing left to gain without significant additional risk. There should be a corollary to Joseph Kennedy's famous dictum, announced in the wake of the 1929 crash, that "only a fool holds out for the top dollar." That corollary might go something like: "A fool and his bull market are too easily parted." For those sensitive to the early entry opportunities Dow theory can offer, Dow theory is no less effective in letting them know when to get out. As if the averages confirm in the near term, then that "when" is still not "now."
David Penn may be reached at DPenn@Traders.com.
SUGGESTED READINGBulkowski, Thomas [2000]. Encyclopedia Of Chart Patterns, John Wiley & Sons.Edwards, Robert D., and John Magee [2001]. Technical Analysis Of Stock Trends, 8th ed., W.H.C. Bassetti, ed. Saint Lucie Press. Russell, Richard. "The History Of Dow Theory," Dow Theory Letters at DowTheoryLetters.com. Charts courtesy of TradeStation
Current and past articles from Working Money, The Investors' Magazine, can be found at Working-Money.com
|
Technical Writer for Technical Analysis of STOCKS & COMMODITIES magazine, Working-Money.com, and Traders.com Advantage.
| Title: | Traders.com Technical Writer |
| Company: | Technical Analysis, Inc. |
| Address: | 4757 California Avenue SW |
| Seattle, WA 98116 | |
| Phone # for sales: | 206 938 0570 |
| Fax: | 206 938 1307 |
| Website: | www.traders.com |
| E-mail address: | DPenn@traders.com |
Traders' Resource Links | |
| Charting the Stock Market: The Wyckoff Method -- Books | |
| Working-Money.com -- Online Trading Services | |
| Traders.com Advantage -- Online Trading Services | |
| Technical Analysis of Stocks & Commodities -- Publications and Newsletters | |
| Working Money, at Working-Money.com -- Publications and Newsletters | |
| Traders.com Advantage -- Publications and Newsletters | |
| Professional Traders Starter Kit -- Software | |
PRINT THIS ARTICLE

Request Information From Our Sponsors
- StockCharts.com, Inc.
- Candle Patterns
- Candlestick Charting Explained
- Intermarket Technical Analysis
- John Murphy on Chart Analysis
- John Murphy's Chart Pattern Recognition
- John Murphy's Market Message
- MurphyExplainsMarketAnalysis-Intermarket Analysis
- MurphyExplainsMarketAnalysis-Visual Analysis
- StockCharts.com
- Technical Analysis of the Financial Markets
- The Visual Investor
- VectorVest, Inc.
- Executive Premier Workshop
- One-Day Options Course
- OptionsPro
- Retirement Income Workshop
- Sure-Fire Trading Systems (VectorVest, Inc.)
- Trading as a Business Workshop
- VectorVest 7 EOD
- VectorVest 7 RealTime/IntraDay
- VectorVest AutoTester
- VectorVest Educational Services
- VectorVest OnLine
- VectorVest Options Analyzer
- VectorVest ProGraphics v6.0
- VectorVest ProTrader 7
- VectorVest RealTime Derby Tool
- VectorVest Simulator
- VectorVest Variator
- VectorVest Watchdog


