HOT TOPICS LIST
- Strategies
- Stocks
- Buy
- Investing
- Brokers
- Psychology
- Interviews
- Accumulate
- Sell
- Hold
- Spotlight
- Websites
- Candlestick Corner
- Gold & Metals
- Options Trading
LIST OF TOPICS
THE CHARTIST
ADX: An Indicator And Trading System
02/11/04 04:12:24 PM PSTby Ashwani Gujral
The average directional movement index can be both. Here's how.
| Trend following remains the single most popular strategy for making huge profits in the stock markets. A trend is a series of rising or declining prices over any length of time. An uptrend market sees consistently higher prices over time, while a downtrend market sees consistently lower prices over time. There are three types of trend: primary, secondary, and minor. Primary trends can be either a series of rising prices or declining prices. They can last from one to several years. Secondary trends are intermediate or corrective to the primary trend. These trends last from one to three months, and retrace one- to two-thirds of the secondary trend. Minor trends are short-term movements that last from one day to three weeks. Market movements can be characterized by two distinct types of phases. In one, the market shows trending movements either up or down. Trending movements have a directional bias over a period of time. In the another, the market shows trading range movements or consolidation, where the market shows no consistent directional bias and trades between two levels. Both phases of the market require the use of different types of indicators. Trending markets need trend-following indicators such as the moving averages, moving average convergence/divergence (MACD), and so on. Trading range markets need oscillators such as the relative strength index (RSI) and stochastics, which use overbought and oversold levels. Thus, identifying the market phase is critical to the determining the methodology the trader needs to follow. THE ADX The ADX, or average directional movement index, fills this need of identifying the trending or the trading phase of the market. J. Welles Wilder developed the ADX — to my mind, his most useful and least understood invention. The ADX defines the degree of directional movement, not the direction. The directional movement system is a trading system based on the use of ADX that gives timing information based on the strength of the underlying trend. In this article I will discuss the interpretations of ADX reading and rules of timing signals achieved from the directional movement system.
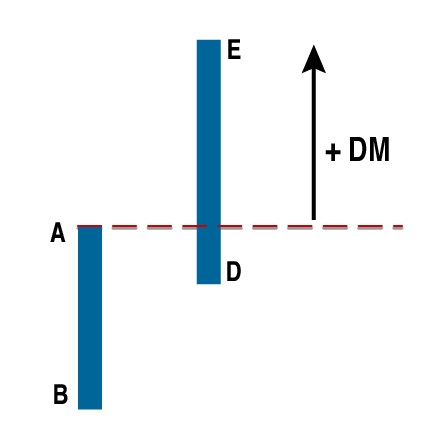
DIRECTIONAL MOVEMENTDirectional movement is defined as the difference between the extreme of the current period that falls outside the range of the previous period. In terms of a daily chart, price action above yesterday's high is positive directional movement (+DM), while anything below yesterday's low is negative directional movement (-DM). This analysis can be applied to monthly, weekly, daily, or intraday data. Figures 1 through 4 show movement across two trading days and the positive directional movement (+DM), negative directional movement (-DM), and zero directional movement. In Figure 1, two bars depicting market action on consecutive days are shown. The part EA on the second day, which lies above the range of the first day, is defined as positive directional movement (+DM).
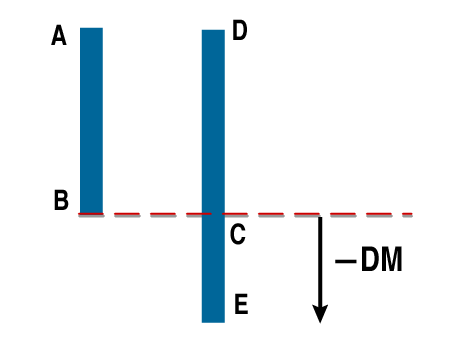
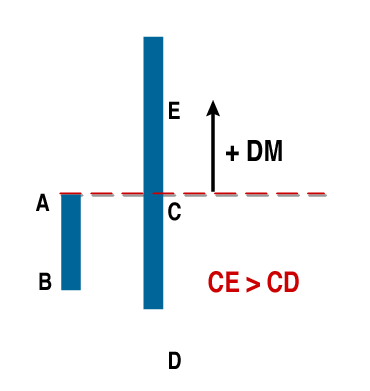
Figure 1: Positive directional movement In Figure 2, the area CE that lies below the range of the second day is known as negative directional movement. Figure 3 shows an outside day, which is a day with a range that encompasses all of the movement of the previous day. In this case both CD and CE exceed AB, so the greater of the two defines the directional movement index — that is, +DM.
Figure 2: Negative directional movement
Figure 3: Outside day. Directional movement taken as the greater CD and CE is taken. Figure 4 shows an inside day, where the range of the first day encompasses the entire movement of the second day. As no directional bias is achieved on this day, there is zero DM.
Figure 4: Inside day. The DM is considered zero as there is not directional movement.
THE DIRECTIONAL INDICATOR (DI)When absolute difference in price movement failed to take into account the proportion of movement, J. Welles Wilder developed the directional indicator. To make directional movement consistent across all stock prices, Wilder decided that price movements were best described as ratios rather than absolute numbers and divided the directional movements (+DM) and (-DM) by the market's true range. Since no trend is determined in a day, the DIs are calculated over a number of days. Wilder decided to use 14 days for this purpose. The DIs provide the timing signals in the directional movement system. An understanding of this now gives a background to interpret the ADX and use timing signals effectively.
INTERPRETING THE ADX AND DIFrom the DI the ADX was developed, and we will now move to how to use this indicator, which has been programmed into most popular technical analysis software. The first step in using the ADX is to identify a security with a high ADX, since it would offer enough directional movement to make trend-following trades. A high ADX value defines a strong trend; the trend could be up or down. A low ADX shows a consolidation and usually indicates a market that will be difficult to trade. In general, the following rules may be followed with regard to the ADX:
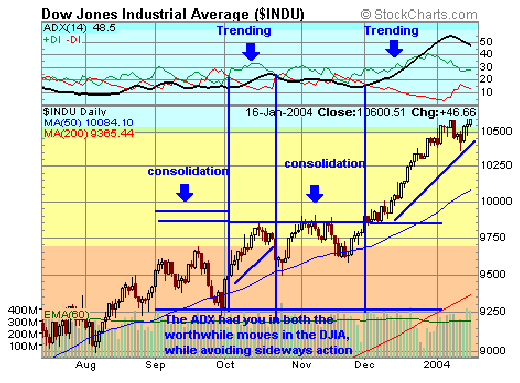
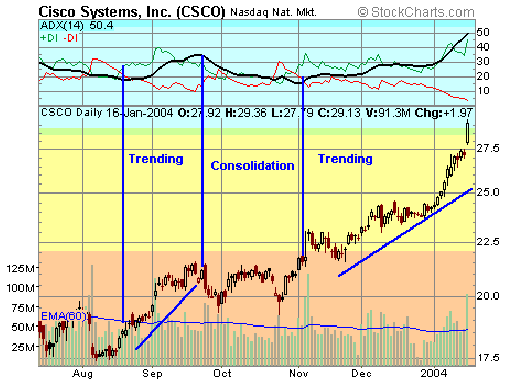
The DI can also be used as timing devices. Long trades can be entered when +DI moves over -DI, and short trades may be entered when -DI moves below +DI. The success of this timing methodology depends on the strength of the trend determined by the ADX. The higher the strength of the trend, the greater the directional movement. The stronger the trend, the less whipsaws will be given by the DIs. Wilder notes that important turns are indicated when the ADX reverses direction after it has moved above both the DIs. Divergence between the ADX and the price is an important indicator of an impending reversal. Profits should be booked at every level once the ADX tops out. DI signals may happen with lagging effect. The ADX should be used to filter the DI signals, taking only the ones occurring when ADX indicates trending. Conversely, when the ADX is at very low levels, Wilder recommends not using the trend-following systems. Let's go through some examples and see how we can best use this trading system. As you can see from Figures 5 and 6, the ADX keeps you in the trending moves while indicating consolidations. I use lighter volume during consolidations and substantially higher volumes during trending moves. The cut in volume during consolidations could be in the order of two-thirds of the trending volume, which effectively means taking substantial profits off the table as the trending market transits into a trading market.
Figure 5: The ADX had you in the worthwhile moves in the DJIA while avoiding sideways action.
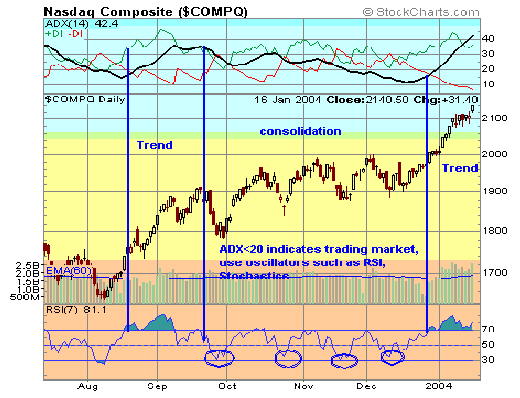
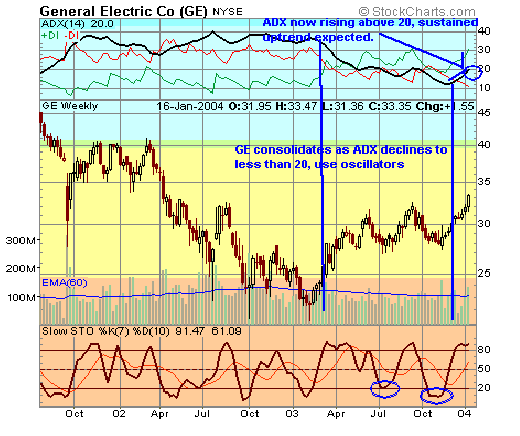
Figure 6: Here you see the ADX does well in identifying trending and consolidating markets. The most effective signals from the ADX are received when the ADX rises from a very low level to above 15 continuing on beyond 30. ADX can also be used as a filter for various trend-following indicators such as the MACD and moving averages, which give whipsaws in consolidating markets. Figures 7 and 8 show examples of trading markets and how they can be traded using oscillators. RSI(7) and stochastics(7,10) should be used to trade consolidating markets with a low ADX. Another option is to use credit spreads or covered calls to take advantage of time decay.
Figure 7: In this daily chart of the Nasdaq Composite, note how the use of the RSI oscillator works well during consolidating markets.
Figure 8: The stochastic oscillator also works well during consolidating markets.
SUMMARYThe ADX indicator and the directional movement systems are among the most useful tools in technical analysis. The most important aspect of the ADX and the DIs is that they keep you in the trend and they work in all time frames. Technical analysis works best when there is confluence of indicators and patterns, and so, I would advise traders to use the ADX in conjunction with other technical patterns and indicators.
Ashwani Gujral is a technical analyst, commentator, author, and trainer based in India. He follows both Indian and US markets. He is an active short-term trader and money manager.
SUGGESTED READINGPring, Martin J. [1993]. Martin Pring On Market Momentum, International Institute for Economic Research.Wilder, J. Welles [1978]. New Concepts In Technical Trading Systems, Trend Research.
Current and past articles from Working Money, The Investors' Magazine, can be found at Working-Money.com.
|
PRINT THIS ARTICLE

Request Information From Our Sponsors
- StockCharts.com, Inc.
- Candle Patterns
- Candlestick Charting Explained
- Intermarket Technical Analysis
- John Murphy on Chart Analysis
- John Murphy's Chart Pattern Recognition
- John Murphy's Market Message
- MurphyExplainsMarketAnalysis-Intermarket Analysis
- MurphyExplainsMarketAnalysis-Visual Analysis
- StockCharts.com
- Technical Analysis of the Financial Markets
- The Visual Investor
- VectorVest, Inc.
- Executive Premier Workshop
- One-Day Options Course
- OptionsPro
- Retirement Income Workshop
- Sure-Fire Trading Systems (VectorVest, Inc.)
- Trading as a Business Workshop
- VectorVest 7 EOD
- VectorVest 7 RealTime/IntraDay
- VectorVest AutoTester
- VectorVest Educational Services
- VectorVest OnLine
- VectorVest Options Analyzer
- VectorVest ProGraphics v6.0
- VectorVest ProTrader 7
- VectorVest RealTime Derby Tool
- VectorVest Simulator
- VectorVest Variator
- VectorVest Watchdog

