HOT TOPICS LIST
- Strategies
- Stocks
- Buy
- Investing
- Brokers
- Psychology
- Interviews
- Accumulate
- Sell
- Hold
- Spotlight
- Websites
- Candlestick Corner
- Gold & Metals
- Options Trading
LIST OF TOPICS
THE CHARTIST
A Look At Volume-Weighted Moving Averages
02/18/04 04:01:43 PM PSTby Paul Fell
There are various moving average techniques, but volume isn't usually a part of its analysis. Except for this one method.
| A plethora of moving average techniques are used by investors and traders alike. The most common include simple, exponential, triangular, and variable moving averages, to name only a few. The moving average is versatile; other indicators/oscillators may also rely on moving averages in their own calculations. Most moving average methodologies do not include volume in its analysis, yet price and volume are intricately bound. The volume-weighted moving average, which should not be confused with the volume-adjusted moving average, relates price to volume.
MOVING AVERAGESMoving averages are popular amid today's investors. A moving average can be thought of as a sliding window over a period of time in which an average for that period is calculated. By charting moving averages over two different periods, many investors focus on the crossovers of two (or more) moving averages as possible entry or exit points for a trade. For all their appeal, volume is ignored by the majority of moving average techniques, and many other indicators and oscillators do as well. Yet volume is important in trying to gauge market sentiment. You cannot have price unless you have volume.
METHODOLOGYLet me introduce some background to the volume weighting methodology using a mining and exploration company as an example. Such companies need to make decisions based on information obtained in drilling. Generally, the geologists working at those companies will segregate samples based on the downhole geology for separate analyses. Or, in the case of reverse circulation drilling, rock chips are obtained over specified intervals (for example, 1, 2, 3m) and are sent off to laboratories for sampling. For each hole, there are analytical results (assays), each relating to a particular downhole interval. In the case of drill core; the intervals are unlikely to be the same length. A regular practice and statistically sound approach in the industry is to average grades over prospective zones; these usually contain two or more intervals of unequal length. The averaging process does not simply add up the grades (Figure 1) and divide by the number of intervals. Instead, it weights the grade by length.
The simplistic approach to estimating an average is to simply add up the gold grades and divide by the total length:
Total grade (g/t) = 3.4 + 4.1 + 8.5 + 2.8 = 18.8 Total length = 5.65 Average grade over prospective zone = 18.8 /5.65 = 3.33 g/t
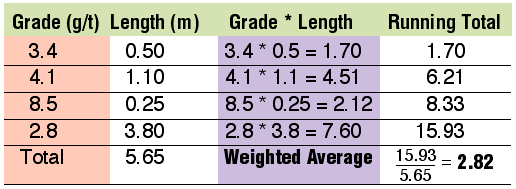
The problem with this approach? It applies equal weight to each of the grades. Yet the 8.5 g/t only occurs over a small .25m interval and 2.8 g/t occurs over a 3.8m interval. More emphasis (weight) must be applied to the grades in the longer intervals. A more statistically correct solution is to apply length weighting (Figure 2). Compare this to the simplistic calculation earlier. Length weighting has applied less weight to smaller intervals and more weight to longer intervals. The average grade for the zone is 2.82 g/t, which is more realistic than that produced using a simple averaging.
Now look at shares. Here we have two basic variables, price and volume. Just as there cannot be grade without an interval over which it is measured, there cannot be price without volume. The two are intricately related; you cannot have one without the other. Unfortunately, there is a complication. With the exception of intraday traders, it is likely that the majority of us will rely on the high, low, open, and close prices; none of these relate to the total volume for the day. They are merely a statistic taken over the day. One essential statistic is missing, and this is the volume-weighted average (not to be confused with volume-weighted moving average of this article). In a similar style to mining grades, the volume-weighted average is calculated by multiplying each trade's price by the volume associated with it and maintaining a running total for this and also for volume (similar to Figure 2) over the day's trading. At the close of trading, the weighted average price for the day is computed as:
WA Price for Day = Sum of (Price * Volume) / Sum of Volume
This is one of the most powerful statistics you can use. Together with the standard statistics reported by the exchanges, it provides a good measure of market sentiment for the day. As an example, in Figure 3, the weighted average price for the day is near the close. In the spectrum of prices for the day, the weighted average price is showing that the money seems to be with the bulls.
Even though the calculation is simple, this facility is not generally available to subscribers unless paid for. In Australia, the fee is more than A$400 per month. As most of us will not have a volume-weighted average, the rest of this article will focus on the closing price. However, it is a statistic that should be reported alongside OHLC statistics and at no extra cost to subscribers (because the algorithm is simple). In Figure 4, we look at an example of a stock. The data is purely hypothetical and simplified to demonstrate the methodology. A simple average for this data is computed as:
SA = (15.0 + 15.5 + 16.0 + 16.5)/4 = 15.75
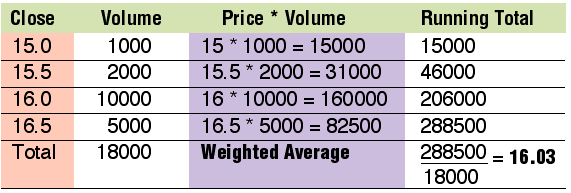
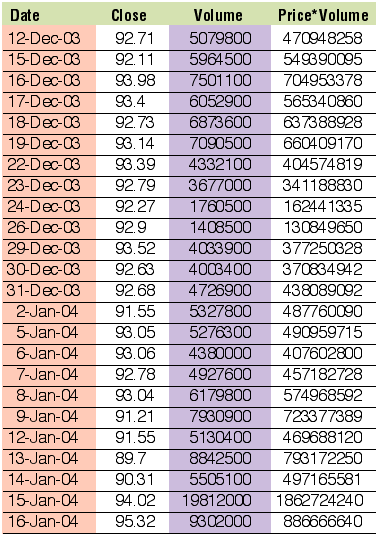
However, this does not take account that both the 16.0 and 16.5 prices had significantly more volume behind them. Now compare this with the weighted average in Figure 4. The price of 16.03 reflects a more accurate volume-weighted price. More weight has been rightly applied to those prices with larger volumes. This methodology can now be extended to a moving average. In Figure 5, I used IBM closing prices. The last column is the Close * Volume. Say we want to compute a 12-day volume-weighted moving average. The first average we would need to calculate is based on the data highlighted in blue. The calculation is:
For the date range 12/12/03 to 12/30/03: Average = Sum(Price * Volume) / Sum(Volume) = 93.04
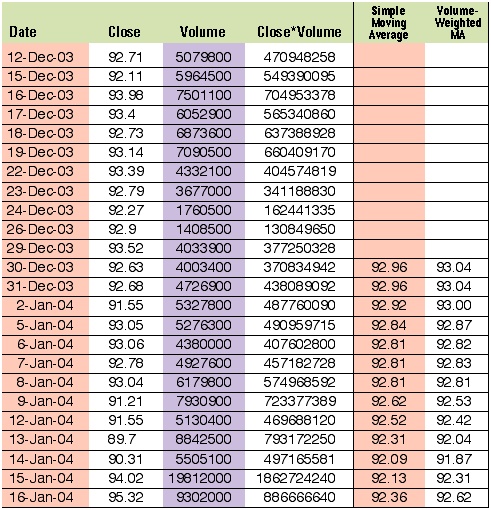
Figure 5: IBM prices The window then moves to the next day (12/12/03 is dropped off and 12/31/03 is included). Figure 6 shows the 12-day volume-weighted moving average. For comparison, the simple moving average is also shown.
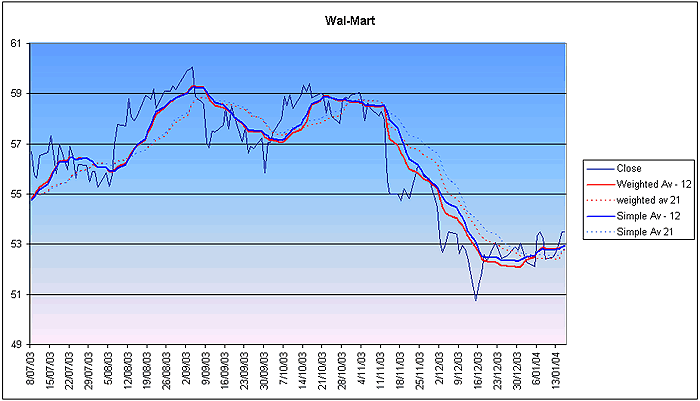
Figure 6: IBM moving averages In Figure 7 you see a chart of Wal-Mart (Wmt) closing prices, simple moving averages, and volume-weighted moving averages for 12- and 21-day periods, respectively. Subtle differences exist between the two averages. The essential difference is in the methods used in the volume-weighted moving average. Whereas most of the other moving average techniques focus on price alone, the volume-weighted moving average quite rightly zeroes in on price and volume and relates them in a statistically sound way.
Figure 7: Closing prices, simple moving averages, and volume weighted moving averages. CONCLUSIONWith a slight variation to the simple moving average method, I derived a moving average that relates price and volume. By applying a volume-weighting factor, I give less emphasis to prices with lower volumes and more emphasis to prices with higher volumes. Even so, the best statistic to use in this, and indeed most other indicators and oscillators, is the daily weighted average.
Paul Fell is general manager of an Australian software house based in Perth, which develops financial add-in applications for Excel. Its flagship product, XLChartPro, is a point & figure charting package. In addition to Working Money, he has contributed articles to Asia's ChartPoint magazine, GuppyTraders, and the Australian Technical Analysts Association Journal. He may be reached at paul@xlchartpro.iinet.net.au.
http://www.xlchartpro.iinet.net.au
Current and past articles from Working Money, The Investors' Magazine, can be found at Working-Money.com. |
| E-mail address: | paul@xlchartpro.iinet.net.au |
PRINT THIS ARTICLE

Request Information From Our Sponsors
- StockCharts.com, Inc.
- Candle Patterns
- Candlestick Charting Explained
- Intermarket Technical Analysis
- John Murphy on Chart Analysis
- John Murphy's Chart Pattern Recognition
- John Murphy's Market Message
- MurphyExplainsMarketAnalysis-Intermarket Analysis
- MurphyExplainsMarketAnalysis-Visual Analysis
- StockCharts.com
- Technical Analysis of the Financial Markets
- The Visual Investor
- VectorVest, Inc.
- Executive Premier Workshop
- One-Day Options Course
- OptionsPro
- Retirement Income Workshop
- Sure-Fire Trading Systems (VectorVest, Inc.)
- Trading as a Business Workshop
- VectorVest 7 EOD
- VectorVest 7 RealTime/IntraDay
- VectorVest AutoTester
- VectorVest Educational Services
- VectorVest OnLine
- VectorVest Options Analyzer
- VectorVest ProGraphics v6.0
- VectorVest ProTrader 7
- VectorVest RealTime Derby Tool
- VectorVest Simulator
- VectorVest Variator
- VectorVest Watchdog


