

HOT TOPICS LIST
- Strategies
- Stocks
- Buy
- Investing
- Brokers
- Psychology
- Interviews
- Accumulate
- Sell
- Hold
- Spotlight
- Websites
- Candlestick Corner
- Gold & Metals
- Options Trading
LIST OF TOPICS
CANDLESTICK CORNER
Market Timing With Candlesticks
02/25/04 04:16:59 PM PSTby Stephen W. Bigalow
Let the market tell you what it's going to do.
| When you pay too much attention to the many market scenarios described by market "experts," it becomes difficult to sort out just what the market is really up to. Keeping track of financial news, whether by radio, Internet, or television, will always provide an excess of opinions of where the market is going. But Japanese candlestick signals will help you circumvent all that noise. Candlestick signals make analyzing the direction of the markets relatively easy.
CANDLES AND SENTIMENTCandlesticks signals make up the cumulative knowledge of all investor input — buying, selling, and sentiment — of a trading entity during a certain time period. The candle signals are especially useful for determing investor sentiment. Candlestick analysis also allows investors to project market reversals with a high degree of accuracy. One misconception about candlestick signals is that there are too many of them to learn. Of the 50 or so candlestick signals that have been identified, a majority of the time only about 10 will appear in your analysis. These include the doji, the bullish and bearish engulfing signals, the hanging man, shooting star, and hammer, the bullish and bearish harami, the dark cloud, the piercing pattern, and the kicker signal. A working knowledge of these signals alone can dramatically improve your analysis of trend reversals.
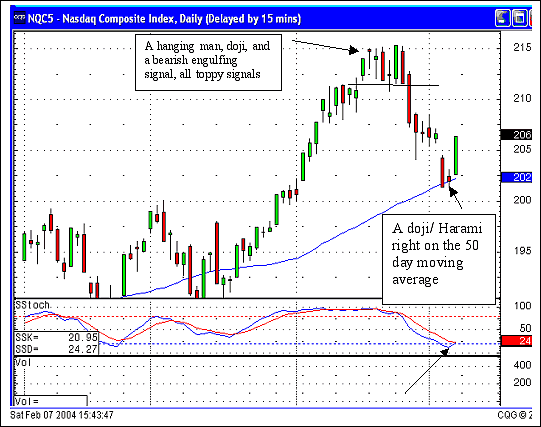
HERE'S HOW IT WORKSThe usefulness of candlestick signals may be clearly illustrated by taking a look at the Dow Jones Industrial Average (DJIA) and the Nasdaq Composite in late January and early February 2004. Starting about the third week in January 2004, the Nasdaq started selling off after a week of obvious sell signals, including a doji, a hanging man, and a bearish engulfing pattern. These were followed a few days later by a hard-sell day that breached the recent low end of the trading range (Figure 1). After a week-long downtrend, a gap down finally appeared at the bottom. This occurred at a time when the stochastics were in the oversold area. Candlestick analysis teaches that panic selling occurs at the bottom of a trend, usually with the appearance of a gap down. This gap was the first alert that price levels were near the bottom. In addition, the Nasdaq Composite closed that day almost exactly on the 50-day moving average.
Figure 1: Daily chart of the Nasdaq Composite. The doji/harami formation on the 50-day moving average, along with the stochastics in oversold territory, suggest that a bottom has been reached.
On the following day, a doji harami formed. This signal also occurred right on the 50-day moving average. What does a harami mean? It signifies that selling has stopped. This should prepare you for a move up. The rule of thumb is that the market is going to move the day after a doji, and it will move in the same direction that it opens. So when you see buying action at the market open, it will provide a head start for you to aggressively buy long positions. As in any investment program, the goal behind your analysis is to find market characteristics that place the probabilities in your favor. When you witness a candlestick buy signal in an oversold condition, the probability that the trade will be profitable is extremely high. An oversold condition can be defined as when stochastics are at or below the 20 level. The ability to add other indicators such as moving averages, Fibonacci retracements, trendlines, and trading channels to a candlestick signal in an oversold condition only enhances the probability of making a profitable trade. When you put all of these observations together, you can create a compelling platform for market timing strategies. On the chart of the DJIA in Figure 2 you can see another example of market sentiment at work. The DJIA spent six indecisive days giving signals such as dojis, spinning tops, and hammers without moving from the 10,500 area. This suggested that the markets might bottom around this level. At the same time, the stochastics were pushing to the oversold area, flattening out, and starting to move upward. These factors are important to an entry decision. The fact that the sellers could not push the DJIA down any further, along with the doji harami that occurred right on the 50-day moving average of the Nasdaq, were strong indications that a market reversal was ready to occur.
Figure 2: Daily chart of the Dow Jones Industrial Average. The DJIA displayed indecision with dojis, spinning tops, and hammers, as well as stochastic levels in oversold territory.
Having this analysis capability in your arsenal allows you to position your portfolio in the correct direction when a move occurs. Understanding the psychology of how the signals are formed provides investors with better insight into where to place positions. The signals in the last week of January 2004 created the opportunity to add short positions, whereas the signals in the first week of February produced high-probability signals suggesting that a trader should cover short positions and add to long positions.
NO ROCKET SCIENCEAfter 400 years of investment results and refinements, candlestick signals have become reliable signals of high-probability, profitable trades. When it comes to investing funds, human emotion will always have the same ingredients: greed and fear. Candlestick signals are visual representations of those investor sentiments. Candlestick signals were not discovered and tested by computer backtesting simulations; instead, they result from centuries of analysis of the human emotions that affect price trends. These signals, which occur over and over at specific points in trend reversals, provide a statistically proven trading platform. If you understand how they are formed, you'll know how to turn them to your advantage.
Steve Bigalow is the author of Profitable Candlestick Trading and the principal of www.candlestickforum.com, one of the leading websites on the Internet for educating investors in the use of candlesticks.
SUGGESTED READINGBigalow, Steve [2002]. "Candlestick Profits," Working Money: February 26._____ [2002]. "Dojis And Gaps," Working Money: June 18. _____ [2003]. "Stop-Loss Procedures Made Easy," Working Money: October 29. Morris, Greg L. [1992]. CandlePower: Advanced Candlestick Pattern Recognition And Filtering Techniques For Trading Stocks And Futures, Probus Professional Publishing. _____ [1995]. Candlestick Charting Explained: Timeless Techniques For Trading Stocks And Futures, Irwin Professional Publishing. Nison, Steve [1991]. Japanese Candlestick Charting Techniques, New York Institute of Finance/Simon & Schuster. Nison, Steve [1994]. Beyond Candlesticks, John Wiley & Sons. Yamanaka, Sharon [2002]. "When Candlesticks Cast Long Shadows," Working Money: March 12.
Charts courtesy CQG
Current and past articles from Working Money, The Investors' Magazine, can be found at Working-Money.com.
|

Stephen W. Bigalow is an author and the principal of the www.candlestickforum.com, a website for providing information and educational material about candlestick investing.
| Website: | www.candlestickforum.com |
| E-mail address: | sbigalow@msn.com |
PRINT THIS ARTICLE

Request Information From Our Sponsors
- VectorVest, Inc.
- Executive Premier Workshop
- One-Day Options Course
- OptionsPro
- Retirement Income Workshop
- Sure-Fire Trading Systems (VectorVest, Inc.)
- Trading as a Business Workshop
- VectorVest 7 EOD
- VectorVest 7 RealTime/IntraDay
- VectorVest AutoTester
- VectorVest Educational Services
- VectorVest OnLine
- VectorVest Options Analyzer
- VectorVest ProGraphics v6.0
- VectorVest ProTrader 7
- VectorVest RealTime Derby Tool
- VectorVest Simulator
- VectorVest Variator
- VectorVest Watchdog
- StockCharts.com, Inc.
- Candle Patterns
- Candlestick Charting Explained
- Intermarket Technical Analysis
- John Murphy on Chart Analysis
- John Murphy's Chart Pattern Recognition
- John Murphy's Market Message
- MurphyExplainsMarketAnalysis-Intermarket Analysis
- MurphyExplainsMarketAnalysis-Visual Analysis
- StockCharts.com
- Technical Analysis of the Financial Markets
- The Visual Investor