HOT TOPICS LIST
- Strategies
- Stocks
- Buy
- Investing
- Brokers
- Psychology
- Interviews
- Accumulate
- Sell
- Hold
- Spotlight
- Websites
- Candlestick Corner
- Gold & Metals
- Options Trading
LIST OF TOPICS
THE CHARTIST
Return To The 50-50 Strategy
03/03/04 04:03:31 PM PSTby Dr. Charles B. Schaap
Once again, the 50-day moving average helps traders out.
| In my December Working Money article, "The 50-50 Strategy," I presented retrospective charts of stocks that had proved to be profitable trades. This time, I will identify stocks that meet the criteria for trading the 50-50 strategy so the progress of the trades can be followed going forward.
APPLYING THE STRATEGYDuring the market correction that took place toward the end of January 2004, the Nasdaq Composite (COMPX) retraced to its 50-day moving average, which means it will now test support at this level. Since about 75% of stocks rise and fall in concert with the major market indexes, such as the COMPX, there will be several stocks at or near their 50-day moving averages. This is the time to look for good trading candidates. The 50-50 strategy is custom-made to take advantage of market pullbacks to the 50-period EMA. During pullbacks, profits are taken on stocks that have risen in price. Such pullbacks are healthy for the stock market, and they set the stage for more potential market runups. So rather than think of pullbacks as negative events, it is best to view them as new opportunities to buy stocks at discounted prices. Keep in mind, though, that the recent market decline could lead to a further decline if the 50-day moving average fails to provide strong support for the COMPX. That is why it is imperative to have stop-loss orders on all stock positions at all times. To recap, the 50-50 strategy is a simple, trend-following strategy for intermediate- to long-term trades. The strategy looks to buy stocks when they have pulled back to their 50-day exponential moving averages (EMA), and when J. Welles Wilder's relative strength index (RSI) is above 50. To help time the trade, the 14-period RSI should be oversold, generally less than 35. Always wait to enter the trade on a three-bar, short-term price reversal. Place a stop-loss order below the 50-day moving average. It is important to make sure that the stock is trending upward on both the daily and weekly time frames. When possible, the best time to enter the 50-50 strategy is in the early stages of a new trend. The new trend may occur after a long consolidation period, or when a trending stock pulls back, then reasserts its upward trend. Avoid stocks that show weak technical patterns such as a double top, or where the stock is nearing a major overhead resistance level. Always take the overall trend of the market indexes into consideration. Should the stock weaken and close below its 50-day moving average, exit the position and reevaluate.
SOME EXAMPLESHere are three stocks that generally meet the criteria for investing using the 50-50 strategy. Some technical insights are provided as additional reasons to consider these stocks:
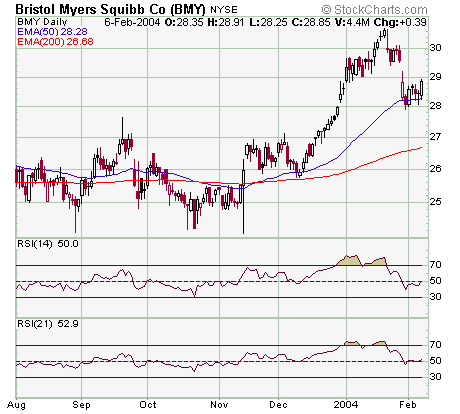
Bristol-Myers Squibb (BMY): This drug manufacturer has a weekly cup-with-handle formation (Figure 1). The daily pullback to its 50-day moving average represents a 50% Fibonacci retracement from the high on January 21, 2004. At $27.85, the stock has just made a double bottom and a three-bar reversal, suggesting higher prices ahead.
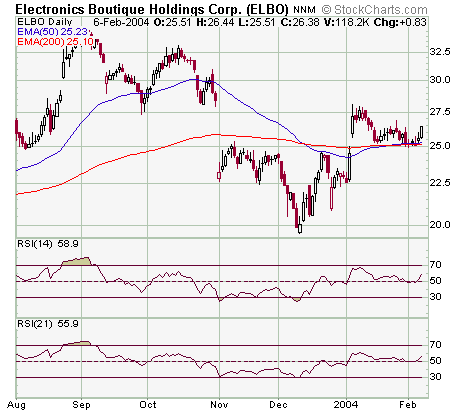
Figure 1: Bristol-Myers Squibb Co. (BMY). Notice that prices have retraced to their 50-day moving average. Does this mean higher prices ahead? Electronics Boutique Holdings Corp. (ELBO): This retail electronics store broke out in January 2004 after a two-month inverted head & shoulders formation (Figure 2). Since then, it has consolidated along the 50-day moving average and appears ready to start another move upward. The longer-term view shows a weekly inverted head & shoulders pattern that is bullish.
Figure 2: Electronics Boutique Holdings Corp. (ELBO). Here prices have consolidated at the 50-day moving average, and it appears as though they are ready to move up.
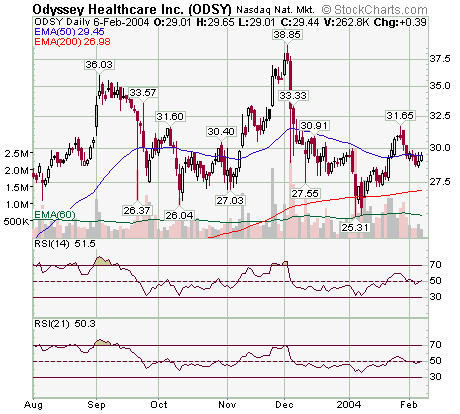
Odyssey HealthCare (ODSY): In health services, Odyssey HealthCare represents long-term care facilities, which will no doubt see increased use as the baby boomer generation ages. Here again, we see an inverted head & shoulders pattern on the daily chart (generally bullish). A recent close at the 50-day moving average should find support. The stock tested and rebounded from its 200-day moving average in January 2004.
Figure 3: Odyssey HealthCare (ODSY). Here you see a head & shoulders bottom and a close at the 50-day moving average. Both are signs that prices may move up. CONCLUSION Stocks that break out above their 50-day moving averages are likely to continue their upward trends. The 50-day moving average provides an excellent entry point with reasonable risk compared to potential profits in the intermediate term. For best results, consider both daily and weekly trends, and make sure that general market indexes, such as the COMPX, are also holding above their 50-day moving averages.
Charles Schaap is a freelance writer, trader, and technical analyst for StockMarketStore.com. He may be contacted at traderdoc@stockmarketstore.com.
SUGGESTED READINGSchaap, Charles B. [2004]. "The 50-50 Strategy," Technical Analysis of STOCKS & COMMODITIES, Volume 22: March.Murphy, John J. [1999]. Technical Analysis Of The Financial Markets, Prentice Hall Press.
Current and past articles from Working Money, The Investors' Magazine, can be found at Working-Money.com.
|
| E-mail address: | traderdoc@stockmarketstore.com |
PRINT THIS ARTICLE

Request Information From Our Sponsors
- StockCharts.com, Inc.
- Candle Patterns
- Candlestick Charting Explained
- Intermarket Technical Analysis
- John Murphy on Chart Analysis
- John Murphy's Chart Pattern Recognition
- John Murphy's Market Message
- MurphyExplainsMarketAnalysis-Intermarket Analysis
- MurphyExplainsMarketAnalysis-Visual Analysis
- StockCharts.com
- Technical Analysis of the Financial Markets
- The Visual Investor
- VectorVest, Inc.
- Executive Premier Workshop
- One-Day Options Course
- OptionsPro
- Retirement Income Workshop
- Sure-Fire Trading Systems (VectorVest, Inc.)
- Trading as a Business Workshop
- VectorVest 7 EOD
- VectorVest 7 RealTime/IntraDay
- VectorVest AutoTester
- VectorVest Educational Services
- VectorVest OnLine
- VectorVest Options Analyzer
- VectorVest ProGraphics v6.0
- VectorVest ProTrader 7
- VectorVest RealTime Derby Tool
- VectorVest Simulator
- VectorVest Variator
- VectorVest Watchdog


