HOT TOPICS LIST
- Strategies
- Stocks
- Buy
- Investing
- Brokers
- Psychology
- Interviews
- Accumulate
- Sell
- Hold
- Spotlight
- Websites
- Candlestick Corner
- Gold & Metals
- Options Trading
LIST OF TOPICS
THE CHARTIST
Applying Gann Fans
03/17/04 04:08:30 PM PSTby Jacob Singer
How do we apply Gann theory, anyway?
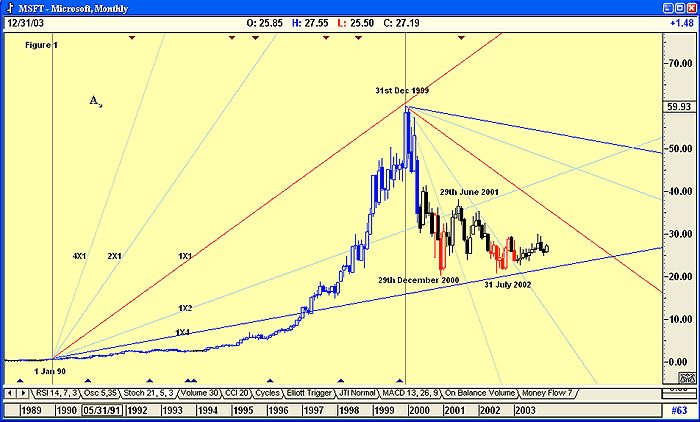
| The first step in technical analysis, according to William Delbert Gann, is the application of a Gann fan. You will know from my previous Working Money article ("The Mystery Of W.D. Gann") that a Gann fan is a combination of a unit of time and a unit of price; it should be applied to monthly and weekly charts to get a sense of market direction, then applied to a daily chart. The monthly chart indicates a turning point; the weekly chart would confirm that turning point; and a daily chart would then fine-tune an entry into a position. I used Microsoft (MSFT) charts for the examples in this article. Typically, you would place a Gann fan on a major or intermediate peak or valley. I started the Gann fan on January 1, 1990, because Gann believed in a 10-year cycle, and after the 1987 market correction, 1990 was the closest decade date. This was probably the start of the bull-market "bubble" that ended in 2000: A standard Gann 10-year cycle.
GANN'S CALCULATIONSWhen I draw a Gann fan, I am a traditionalist. Gann never had the advantage/disadvantage of computers, so he drew all his charts by hand, with one unit of price equal to one unit of time. This creates a square, and the diagonal of the square is a 45-degree angle; hence, the Gann primary angle is 1x1. The thinking behind this was that the price would move up within the boundaries of the square, forming a top close to or at the 1x1 line. This worked well with a $1 price, the unit of time being one minute, one hour, one day, or even one week. However, what happened if the average share price was $2, $3, or $5? The unit of time would remain the same, but the unit of price would differ. Gann, therefore, decided to fix his price based on what he experienced. He fixed the unit of price at 1, 2, and 5, and multiples or divisions by 10, 100, or 1,000 of these numbers. Thus, 20 is acceptable, as is 0.05. Once he had established his 1x1 line, Gann would form a fan using a protractor. He divided the angle between the 45-degree and the 90-degree angles into two parts. These he called the 2x1 and the 4x1 if they were below the 1x1, and 1x2 and 4x2 if above. His original fans even had a 1x8 and an 8x1 included, but most computer programs today have left them out.
THE TEN-YEAR CYCLETo analyze the 10-year cycle in Microsoft (MSFT) (Figure 1), the scale of the Gann fan will be 0.5. This is the number that is the best fit for the 1x1 angle of the Microsoft chart; I always try to have the 1x1 move from the low to the high, but because I am a Gann traditionalist, I prefer to use the original number (1, 2, 5, or multiples or divisions by 10 of these numbers). The fan has moved rather nicely between the low and high on December 31, 1999, which is a perfect confirmation of the 10-year cycle Gann believed in so firmly. He wrote that "the first year of a decade, year one, is the year to look for a bear campaign to end and a bull market to begin." As you can see from the chart, this indeed happened. Microsoft stock bottomed on December 29, 2000, exactly one year after its top in December 1999.
Figure 1: Gann fans on a monthly chart. Using January 1, 1990, as a starting point, the fans help in identifying future highs and lows. Gann continues, "The second year, year two, is a year of a minor bull market and a bear market rally." Microsoft moved up in a bear market correction until June 29, 2001. "Year three is the start of a bear year, but the rally from the second year may run into March or April." Year 3 was indeed a bear year, but it started in the middle of year 2, and ran for one year and one month, bottoming in July 2002. Gann detailed the final six years of the cycle:
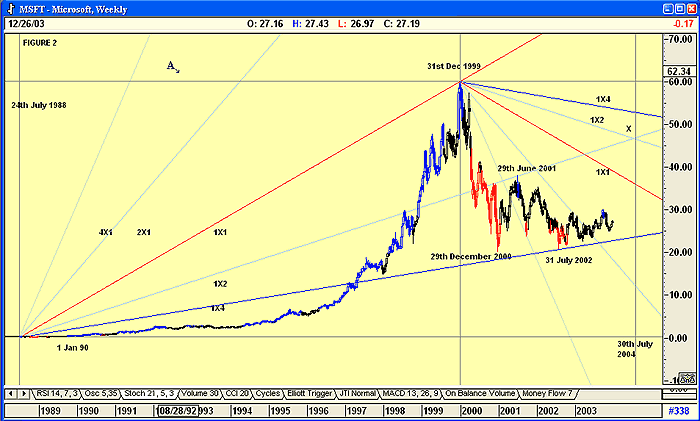
In other words, Gann would forecast a continuation of the bear run for Microsoft in 2004, with the bear cycle ending sometime during the year and the start of a major bull run (with a correction in 2007) into the year 2009. He believed that the 10-year cycle repeated over and over again, and it was the basic road map to all his forecasts. A weekly chart (Figure 2) fine-tuned the start of the Gann fan as July 24, 1988. Note how Microsoft found the 1x2 resistance level on June 29, 2001, and the 1x4 support level on July 31, 2002. With the yearly cycle appearing to resolve itself in the middle of the year, you can forecast that the bear market expected for 2004 should end sometime in July 2004.
Figure 2: Gann fans on a weekly chart. The 1x2 line starting from July 24, 1988, acted as a resistance level. The 1x4 line acted as a support level.
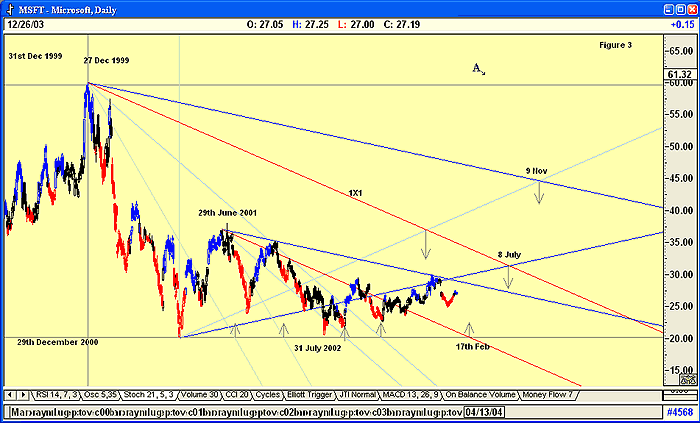
Gann also believed that where angles cross each other, or where they touch a horizontal drawn from a major low or high, they signal a possible turning point. If you look at the chart, you will see that each crossing did indeed occur at a correction to the trend. The end of the suggested bear market and start of a strong bull market in July 2004 is confirmed by the crossing of the two 1x2 angles. Knowing that there will now be a bear market in Microsoft for the first six months of 2004, I will only start looking at a daily chart of Microsoft in May 2004. I have, however, included a daily chart of Microsoft to show how I would analyze it (Figure 3). I would look at the various dates as shown on the chart where Gann angles either cross each other or intersect the horizontal lines drawn from the start of Gann fans. Of course, you can draw fans from even finer turning points, but I will only start doing this from July 2004, allowing a week on either side for a margin of error.
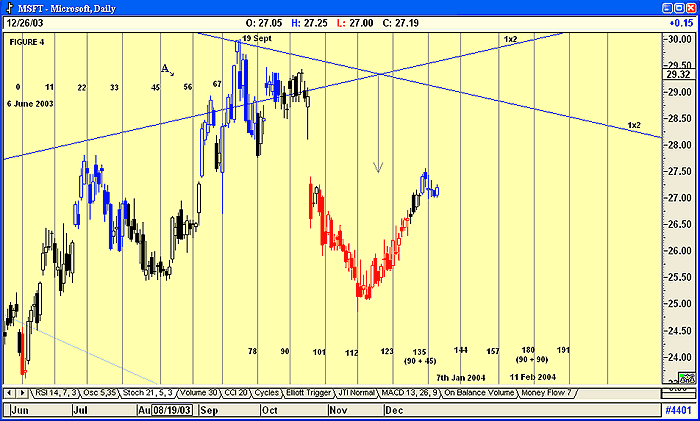
Figure 3: Daily chart of Microsoft (MSFT). The intersections of Gann angles signify turning points. Gann also believed that the 11-, 22-, 33-, 45-, 56-, 67-, 78-, 90-, 180-, and 360-day counts taken from a major low or high were important as possible correction points. He viewed the period between 101 and 112 as being a "death zone" — that is, where a major correction down would occur, forming a market bottom. The number 144 was also important (as the square of 12). Now, some might argue that with so many numbers and turning points, a chart can become self-fulfilling, and this might tend to discredit the Gann analysis. I have found, however, that the 90-, 180-, and 360-day counts are worth keeping in mind. Figure 4 displays a daily chart with a count taken from a major low on the June 6, 2003. The numbers 22, 45, and 90 did call turning points, although the top on September 19 (which found resistance on the 1x2 line) was missed. The period between 101 and 112 was indeed a "death zone." The turning point at 135 days (90+45) was also confirmed. I have highlighted future possible turning points on the chart, namely January 7, 2004 (144 days), and February 11, 2004 (180 days).
Figure 4: Possible correction points. The numbers 11, 22, 33, 45, 56, 67, 78, 90, 180, and 360 bars from major highs or lows are possible correction points. CONCLUSION W.D. Gann was one of the most successful stock and commodity traders who ever operated in the market. Remember that he traded before computers appeared on the scene, with their data suppliers and sophisticated programs that make fancy analytical decisions. He was a student of cycles; they were the basis of all his work. Where today it is easy to run various sine cycle graphs on a chart and compare their interaction to each other, he found it far easier to compare the cycles of the planets and the positions where their cycles around the sun intercepted or influenced each other. Many have likened Gann's work to that of a mystic. This was not so. His work in these areas was a matter of convenience only — a way to reduce the workload. His work should never be discarded; instead, it should be a major arrow in one's technical quiver.
SUGGESTED READINGGann, W.D. [1927]. Tunnel Through the Air, Or Looking Back From 1940, Lambert-Gann Publishing.McLaren, William [1986]. Gann Made Easy, Traders Press.
Current and past articles from Working Money, The Investors' Magazine, can be found at Working-Money.com.
|
Has been a Technical analyst since 1969 and was a member of the Market Technicians Association of America. Worked as a Futures and Options Trader with First Financial Futures in Johannesburg, South Africa for three years, then for Irish Menell Rosenberg, stock brokers in their research department as a Technician specializing in Gold and Gold shares. He was the Editor of a popular South African tipping sheet, Temkin and Moon, till 1992, and emigrated to Canada qualifying as an Investment advisor. Jack has developed and uses a very successful Mutual Fund investment strategy for client portfolios, called MOM Investing. The strategy is available on a weekly updated web page, restricted to clients only.
| Company: | Global Securities Corporation |
| Address: | Three Bentall Centre, 595 Burrard Street |
| Vancouver, BC V7X 1C4 | |
| Phone # for sales: | 604 443 5473 |
| Fax: | 604 689 5401 |
| Website: | regpub.homestead.com/index.html |
| E-mail address: | jsinger@globalsec.com |
Traders' Resource Links | |
PRINT THIS ARTICLE

Request Information From Our Sponsors
- StockCharts.com, Inc.
- Candle Patterns
- Candlestick Charting Explained
- Intermarket Technical Analysis
- John Murphy on Chart Analysis
- John Murphy's Chart Pattern Recognition
- John Murphy's Market Message
- MurphyExplainsMarketAnalysis-Intermarket Analysis
- MurphyExplainsMarketAnalysis-Visual Analysis
- StockCharts.com
- Technical Analysis of the Financial Markets
- The Visual Investor
- VectorVest, Inc.
- Executive Premier Workshop
- One-Day Options Course
- OptionsPro
- Retirement Income Workshop
- Sure-Fire Trading Systems (VectorVest, Inc.)
- Trading as a Business Workshop
- VectorVest 7 EOD
- VectorVest 7 RealTime/IntraDay
- VectorVest AutoTester
- VectorVest Educational Services
- VectorVest OnLine
- VectorVest Options Analyzer
- VectorVest ProGraphics v6.0
- VectorVest ProTrader 7
- VectorVest RealTime Derby Tool
- VectorVest Simulator
- VectorVest Variator
- VectorVest Watchdog


