HOT TOPICS LIST
- Strategies
- Stocks
- Buy
- Investing
- Brokers
- Psychology
- Interviews
- Accumulate
- Sell
- Hold
- Spotlight
- Websites
- Candlestick Corner
- Gold & Metals
- Options Trading
LIST OF TOPICS
Symmetrical Triangles And The MACDH
03/24/04 11:30:09 AM PSTby David Penn
Can a symmetrical triangle be directional? Other tools in the technical toolbox may be able to tell you.
| Is it more important to have an optimized indicator, or to optimize your talents as a technical analyst? While for some this may be a nonissue ("I'd rather both!" shout the chartists), I'm particularly interested in the paths that pave the way toward the latter. More specifically, I wonder which is more important: the indicator or the analyst? Is time better spent examining the ever-expanding matrix of technical indicators for "The One," or are we better off learning how a given indicator works, getting to know it inside and out to the point where the analyst feels he or she knows what the indicator will do before the indicator actually does it? This is the sort of relationship I've tried over the years to develop with the more common chart patterns such as head and shoulders, diamonds, and triangles. Of late, I have tried to cultivate that sort of cozy "knowing me knowing you" kinship with the moving average convergence/divergence histogram (MACDH for short). As a number of prominent market technicians — from Alexander Elder to John J. Murphy — have noted, the MACDH is a very powerful indicator that can be used in both trending and nontrending markets. Whether or not the MACDH is used for divergences, spotting rallies from oversold markets during market advances, or simply determining the relative strength of bulls and bears, the MACDH has been considered one of the basic tools of technical analysis for good reason. However, top-notch technical tools are capable of even greater performance when used with other, equally reputable technical tools. Often, other technical tools can act as a confirming (or nonconfirming) extra pair of eyes that can alert a trader to some market phenomenon that his or her eyes and other indicators fail to note. This discussion, hopefully, will engender more traders and investors to think about the indicators they use regularly and trust the most, with an eye toward the potential for even greater results when trusted and proven indicators are used in concert.
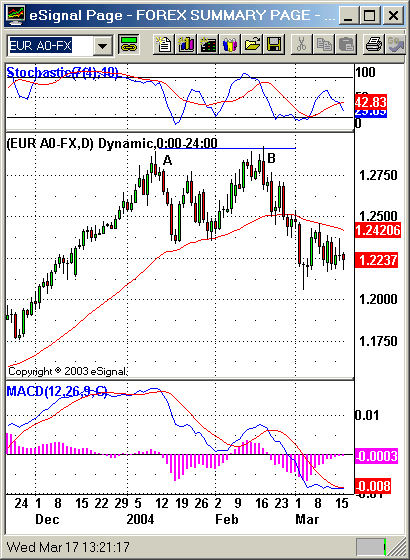
2B, TRENDS AND TOPSLet's take for our example the bull market in the euro currency, or EUR/USD. The most recent advance in the EUR/USD began at the beginning of September 2003, with lows near 1.0765. Prices in mid-February reached 1.2928 before a sharp correction brought the EUR/USD down below its 50-day exponential moving average, and set new lows for the year near 1.2200. The 50-day moving average is especially helpful in the intermediate term, and thus is a good trend marker for both short-term swing traders looking to buy retracements to the support provided by the moving average, as well as for intermediate-term position players looking for dips to buy over the course of a bull market. For a helpful discussion of the 50-day moving average, see Charles Schaap's "Return to the 50-50 Strategy," Working-Money.com, March 3, 2004. The earliest signals that the break below the 50-day EMA might represent a top in the euro's advance come from the two peaks in January and February. One of the best ways for spotting a top is the 2B or Turtle Soup method, courtesy of Victor Sperandeo (Methods Of A Wall Street Master) and Laurence Connors (Street Smarts), respectively. We have also seen a version of this setup from Traders.com Advantage contributor, Jacob Singer (see his "Buying At The Bottom," Traders.com Advantage, February 19, 2004).
Figure 1: This 2B test of top anticipated the declines in EUR/USD.
Essentially, the setup suggests that if prices make a high, pull back, then make a higher high, traders should be on guard to see whether there is follow-through on the second high (the higher high). If there is no follow-through to the upside, then there is a strong possibility that the advance has peaked out for the time being. The degree of the ensuing correction depends on a number of factors — most of which, like overbought conditions or an oscillator divergence, can be picked up by standard technical tools — but the likelihood of a reversal is real. This is exactly what took place with EUR/USD. After registering a higher high in February vis-à-vis the January high, EUR/USD swiftly retreated to support at the 50-day exponential moving average (EMA). This support held for approximately four days before it was broken, mildly at first, but with some force four days later. In fact, it is the two-day collapse beneath the 50-day EMA that has formed the back side of a symmetrical triangle, as prices for EUR/USD have filled in between the high and the low of that two day plunge.
SYMMETRICAL DIRECTIONSIn an article for Traders.com Advantage, I asked whether direction was a complete unknown in dealing with symmetrical triangles ("Temporary Triangle Trouble In The Hourly S&P 500," March 9, 2004)? While symmetrical triangles, by nature, give few post-breakout directional clues in and of themselves, the context in which a trader encounters a symmetrical triangle can often provide at least a few tips as to the more likely resolution of the chart pattern. In the case of the symmetrical triangle in EUR/USD, the 2B/Turtle Soup top is one bearish portent, and the break below the 50-day EMA is another. But there is another important clue that seems to be indicating that the bears are currently stronger than the bulls and that clue lies in the MACD histogram. I've written frequently about the MACD histogram (or MACDH, for short) of late. The MACDH is a fairly common, highly effective indicator sometimes referred to as the MACD oscillator. Unfortunately, its familiarity has led to some misunderstandings about how the MACDH is best used. While it is popular to use divergences in the MACDH in the same way someone might use divergences between price peaks (or troughs) and the relative strength index (RSI) or stochastics, there are dangers to blindly following this approach. (Arthur Hill points out some of these dangers in his Traders.com Advantage article, "Misleading Divergences In The S&P Small Cap Index," March 5, 2004.) It can actually be more worthwhile to compare MACDH peaks to MACDH troughs than to compare the MACDH to price. If, for example, the MACDH moves to a relatively high level as prices advance, then pulls back to a relatively shallow level below the zero line during a correction, then the fact that the high MACDH was higher than the MACDH low was low means that the bulls are still in control. A trader in such a situation should see the shallow MACDH trough as a signal that the bears were not as strong as price action may temporarily make them out to be, and that the corresponding dip — preferably a dip to support at a moving average, trendline or channel — is a buyable dip.
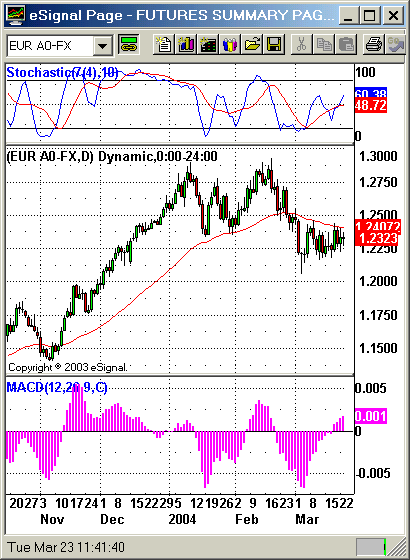
Figure 2: Deep troughs in the MACDH are a bearish portent of prices to come.
Consider the EUR/USD. The MACDH in January and February carved two deep troughs during the corrections that occurred in those two months. The MACDH peaks preceding these two troughs were exceptionally shallow, suggesting that the strength in this market is currently on the sellers' side. Recall that the MACDH is the difference between the two moving averages that make up the moving average convergence/divergence (MACD) indicator. Here, deep MACDH troughs suggest that the shorter-term moving average in the MACD has moved downward faster than the longer-term moving average in the MACD. While it will take some time for the longer-term moving average to catch up, the sharpness of the decline in the shorter-term moving average means that the longer-term moving average will soon be incorporating lower and lower price values and, thus, find itself moving lower. Certainly, new sentiment can enter the market and turn what starts as a selloff into merely a correction. But the deeper the MACDH troughs, the harder it will be for prices to advance in any subsequent rally. This is especially so if other bearish factors are present as well.
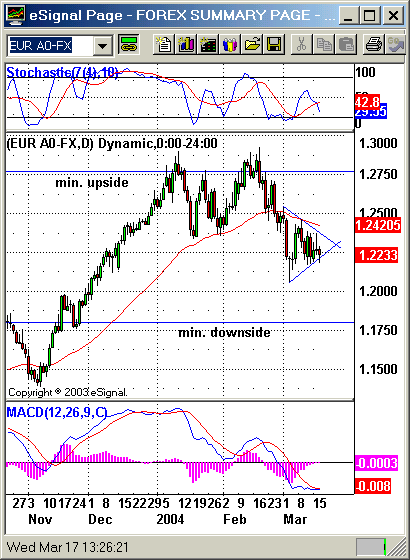
TRIANGLE TRIBULATIONSAs noted previously, the symmetrical triangle in EUR/USD began with the two-day decline that took prices below the 50-day EMA. Since that time, EUR/USD "backed and filled" between the highs and lows of that two-day decline in an ever-shrinking range consistent with the "coiled spring" nature of a symmetrical triangle. This chart pattern has developed over the first two weeks of March 2004. Considering the potential for upside and downside volatility based on this triangle, we can use the measurement rule for symmetrical triangles to determine a minimum upside and downside. In the present case, the symmetrical triangle is approximately 483 points in size at its widest point. Adding this number to the value where the two converging trendlines of the symmetrical triangle meet (approximately 1.2288) provides for a minimum upside of 1.2771 and a minimum downside of 1.1805. In the first case, the upside breakout would send the EUR/USD toward a test of the February highs at 1.2928. In the second case, the downside breakout would see the EUR/USD taking out its year-to-date lows and, in fact, would also take out the December 2003 lows at 1.1937.
Figure 3: A test of the February 2004 highs or a run at the December 2003 lows? A breakout from this symmetrical triangle will likely represent one or the other. It is also worth noting that the low between the January and February peaks in EUR/USD may serve as a form of resistance to any lasting upside breakout from the triangle. In addition, if the two peaks represent a double top, then trader Stan Weinstein's swing rule would suggest that a breakdown in EUR/USD would likely take prices to the 1.1742, approximately 50-odd points off from the minimum downside projected from the symmetrical triangle itself. Recall that Weinstein's swing rule calls for taking the size of a formation from support to peak (or from resistance to trough) and "swinging" the formation 180 degrees to the other side. Thus, the double top in EUR/USD, which stretches 593 points above support, projects to a decline that travels that same 593 points below support.
OPTIMIZE THYSELFIt cannot be known with certainty which direction EUR/USD will move once it emerges from the symmetrical triangle. Thus, it makes sense to have both upside and downside projections. While the argument for a lower EUR/USD — at least in the near term — is buttressed by resistance at the 50-day EMA, bearish MACDH troughs, and a 2B/Turtle Soup top, there is an argument for an advance in EUR/USD. There is an interestingly positive stochastic divergence brewing between the price lows in late February and the lower low in early March, compared to the stochastic low in late February and the higher low in early March. And EUR/USD has already corrected about 40% of the advance from the early September 2003 bottom. This is perhaps why the truly optimized indicator is the well-trained, well-disciplined trader who knows the strengths and limitations of the tools he or she has chosen to use in the market. Understanding, for example, that while deep MACDH troughs suggest selling pressure overwhelming buying pressure, such troughs do not in and of themselves signal "sell!", is one example of a trader learning to optimize him or herself to the indicator. Knowing that an overbought stochastic in a bull market is not an automatic signal to prepare to short is another. Optimized traders, who use multiply quality indicators, know that even the most ideal setup is still a game of probabilities and odds, and being smart enough to zig even after days, weeks, or months of thinking it was time to zag is the greatest trading optimization of all.
David Penn may be reached at DPenn@Traders.com.
SUGGESTED READINGConnors, Laurence A., and Linda Bradford Raschke [1995]. Street Smarts, M. Gordon Publishing Group.Elder, Alexander [1993]. Trading For A Living, John Wiley & Sons. Hill, Arthur [2004]. "Misleading Divergences In The S&P Small Cap Index," Traders.com Advantage, March 5. Murphy, John J. [1996]. The Visual Investor, John Wiley & Sons. Penn, David [2004]. "Temporary Triangle Trouble In The Hourly S&P 500," Traders.com Advantage, March 9. Schaap, Charles [2004]. "Return To The 50-50 Strategy," Working-Money.com, March 3. Singer, Jacob [2004]. "Buying At The Bottom," Traders.com Advantage, February 19. Sperandeo, Victor [1991]. Trader Vic — Methods Of A Wall Street Master, John Wiley & Sons. Weinstein, Stan [1988]. Secrets For Profiting In Bull And Bear Markets, Dow Jones-Irwin.
Charts courtesy eSignal
Current and past articles from Working Money, The Investors' Magazine, can be found at Working-Money.com.
|
Technical Writer for Technical Analysis of STOCKS & COMMODITIES magazine, Working-Money.com, and Traders.com Advantage.
| Title: | Traders.com Technical Writer |
| Company: | Technical Analysis, Inc. |
| Address: | 4757 California Avenue SW |
| Seattle, WA 98116 | |
| Phone # for sales: | 206 938 0570 |
| Fax: | 206 938 1307 |
| Website: | www.traders.com |
| E-mail address: | DPenn@traders.com |
Traders' Resource Links | |
| Charting the Stock Market: The Wyckoff Method -- Books | |
| Working-Money.com -- Online Trading Services | |
| Traders.com Advantage -- Online Trading Services | |
| Technical Analysis of Stocks & Commodities -- Publications and Newsletters | |
| Working Money, at Working-Money.com -- Publications and Newsletters | |
| Traders.com Advantage -- Publications and Newsletters | |
| Professional Traders Starter Kit -- Software | |
PRINT THIS ARTICLE

Request Information From Our Sponsors
- StockCharts.com, Inc.
- Candle Patterns
- Candlestick Charting Explained
- Intermarket Technical Analysis
- John Murphy on Chart Analysis
- John Murphy's Chart Pattern Recognition
- John Murphy's Market Message
- MurphyExplainsMarketAnalysis-Intermarket Analysis
- MurphyExplainsMarketAnalysis-Visual Analysis
- StockCharts.com
- Technical Analysis of the Financial Markets
- The Visual Investor
- VectorVest, Inc.
- Executive Premier Workshop
- One-Day Options Course
- OptionsPro
- Retirement Income Workshop
- Sure-Fire Trading Systems (VectorVest, Inc.)
- Trading as a Business Workshop
- VectorVest 7 EOD
- VectorVest 7 RealTime/IntraDay
- VectorVest AutoTester
- VectorVest Educational Services
- VectorVest OnLine
- VectorVest Options Analyzer
- VectorVest ProGraphics v6.0
- VectorVest ProTrader 7
- VectorVest RealTime Derby Tool
- VectorVest Simulator
- VectorVest Variator
- VectorVest Watchdog


