HOT TOPICS LIST
- Strategies
- Stocks
- Buy
- Investing
- Brokers
- Psychology
- Interviews
- Accumulate
- Sell
- Hold
- Spotlight
- Websites
- Candlestick Corner
- Gold & Metals
- Options Trading
LIST OF TOPICS
DOW THEORY
Bearish Confirmations
04/14/04 04:07:01 PM PSTby David Penn
What can investors and traders make of the first bearish confirmation in the Dow averages in a year?
| How have the Dow averages decided to celebrate the one-year anniversary of the beginning of the bull market from the March 2003 lows? After a positive January, the Dow transports broke down sharply beneath their 50-day exponential moving average (EMA) in February. The Dow industrials were more or less flat for the month, providing some solace for bullish traders and investors. Because the industrials did not confirm the fresh lows made in the transports, the Dow theory principle of confirmation suggests that the prevailing trend of the market before the nonconfirmation must be considered intact. As Robert Edwards and John Magee wrote in their seminal work, Technical Analysis Of Stock Trends, under the heading "A trend should be assumed to continue in effect until such time as its reversal has been definitely signaled":
This Dow theory tenet is one which, perhaps more than any other, has evoked criticism. Yet when correctly understood it, like all the others we have enumerated, stands up under practical test. What it states is really a probability. It is a warning against changing one's market position too soon, against 'jumping the gun.' It does not imply that one should delay action by one unnecessary minute once a signal of change in trend has appeared, but it expresses the experience that the odds are in favor of the man who waits until he is sure, and against the other fellow who buys (or sells) prematurely.
Thus, even as the transports weakened in February, the continued resilience of the industrials meant that "at best, the direction of the primary trend is . . . in doubt," to quote Edwards and Magee again. In fact, while the transports were rallying from their steep end-of-January correction — a correction that took the transports under their 50-day EMA — the industrials were spending the first few days of February making new bull market highs.
From nonconfirmation to confirmationAs I have written for Traders.com Advantage, February and March 2004 proved to be a waiting game for the Dow averages. Would the next confirmation (the previous confirmation was a bullish one with the January 2004 highs) support higher prices in March — as I alluded in an early March article — or would the next confirmation be a bearish one, suggesting that lower prices were more likely going forward? In the March 2nd article, I focused on the possibility of the transports making a marginally higher March high vis-à-vis February. Such a move, as modest as it might have been, could have been bullish in the context of a similar move above the March highs by the industrials. The support provided by the 50-day EMA seemed to suggest that the industrials were as likely to move strongly to the upside as to the downside (though there were ominous signals from the MACD histogram, or MACDH — more on that later).
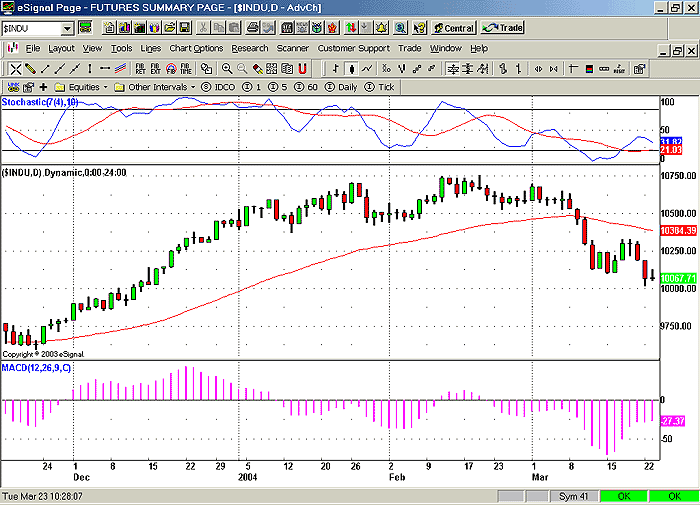
Figure 1: Confirming the industrials' January highs, the transports' collapse late in the month set the stage for a series of nonconfirmations. But the transports did not take out the February highs during the advance that started at midmonth and puttered out by the beginning of March. It is important to note that the industrials' consolidation range in February became more and more extended, with little sign of the "explosive" move upward I wondered about in the previously mentioned piece. In three days, however, from March 9 through March 11, any sign of that upward move was shattered as the Dow industrials plunged below their 50-day EMA in concert with Dow transports that was similarly taking out its February lows. There it was: the long-awaited confirmation. Only unlike the January confirmation, the March confirmation suggested more downside to come. Since that confirmation period of March 9-11, the transports have broken to fresh lows and are now moving toward a test of the October lows at 2672. The industrials, currently priced at mid-December 2003 levels, began the last full week of March some 275 points away from their December 2003 lows. Having spent so much time warning against chasing the signals of a nonconfirmation, I should recap the path from the bullish January confirmation to the various nonconfirmations of February to what appears to be the bearish March confirmation. The last bullish confirmation was on January 26 in the industrials. This high for the move confirmed the earlier high for the move made by the transports on January 22. Looking at the daily charts of the Dow averages, it is clear that this is where the divergence between the industrials and the transports began. Divergence or nonconfirmation does not provide a signal in the classic Dow theory methodology, but it is worthwhile to make the observation.
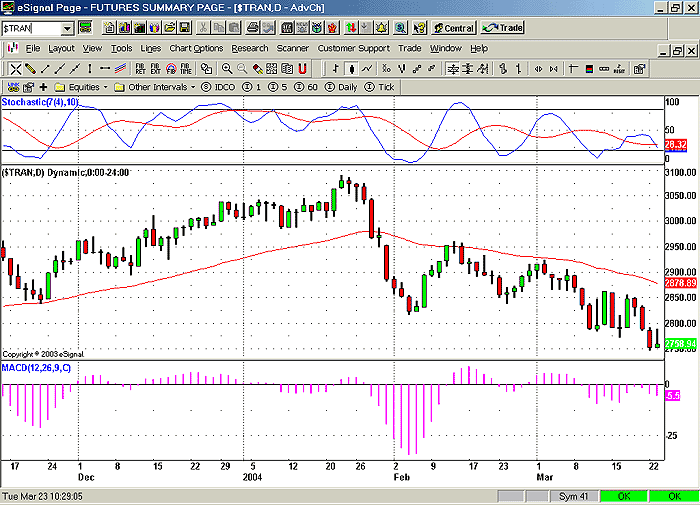
Figure 2: Not only did the industrials make a higher high in February vis-à-vis January, they also remained resilient over the balance of February while the transports continued to correct. What followed was a series of nonconfirmations. The transports set a new lower January low on the 28th of the month, and ended January barely above the November 2003 lows. By February 4, those November lows had also been bested by the plunging transports. On the other hand, the industrials finished January without setting a lower low toward the end of the month. In February, instead of taking out its November lows — as the transports did — the industrials actually set a new high vis-à-vis January. So we had an industrials average fail to follow the transports down, then an instance in which the transports failed to follow the industrials back up. As the markets moved into late February, a number of interesting developments took place. First, both the industrials and the transports registered higher lows on February 24. After the nonconfirmations, this was a relatively bullish indication. Why? Because if the prevailing trend was still considered upward, and the two averages were confirming each other's higher low, there was a strong chance that both averages would resume the prevailing, upward trend. Unfortunately for the bulls, March 9 saw both averages close beneath that previous higher low, essentially rendering it meaningless. More alarming for the bull case was the fact that the averages appeared to be in gear once again — but, potentially, now to the downside. One day later, the industrials took out both the February and January lows. The Dow transports dutifully spent the same day doing the exact same thing. With the January and February lows a thing of the past — and with both averages repeatedly closing beneath their 50-day EMAs — a textbook reading of Dow theory could come to no other conclusion than that the market was a sell. What would it take for a bullish/buy signal? At this point, given the severity of the March 22nd declines, it is hard to speculate. But considering the way the market moved from bullish confirmation to nonconfirmation to a bearish confirmation, it might be a good idea for bulls to look for nonconfirmations first (that is, higher lows in one average compared to lower lows in the other) and bullish confirmations second. While it is certainly possible for both averages to reverse trend together, it may be more likely for one average to reach its downside limit first and begin to rally. Given the extent of the declines (the transports are down about 11%, while the industrials are down closer to 6% from their January 2004 and February 2004 highs, respectively), there is a gambler's chance that the transports will bottom before the industrials do. Beyond that, a few technical aspects underscore the likelihood that the transports will be the first of the two to recover. But until there is a bullish confirmation, there is no real reason to believe that the market has turned back up in any sustainable way.
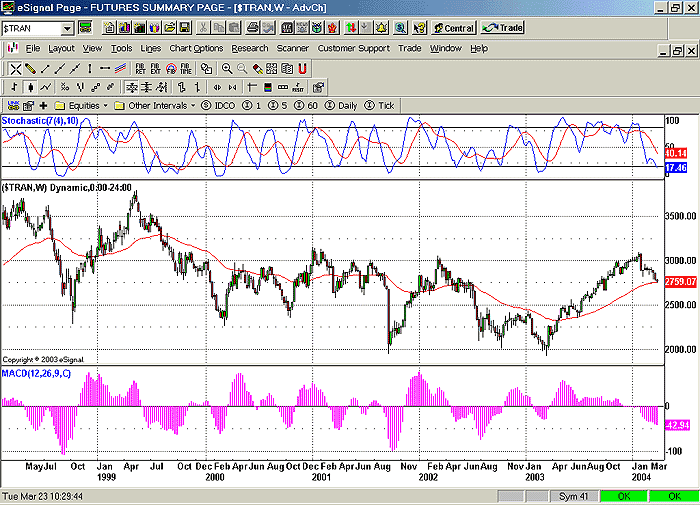
Moving averages and long-term looksDo the Dow averages look any different from a longer-term time frame, such as a weekly? In one important respect, they do, at least for the time being, and that is the 50-week moving average. The 50-week moving average (exponential version shown in Figure 3) is roughly equivalent to the long-term 200-day moving average. Cast upon a chart of weekly data, the 50-week EMA is a solid tool for examining and measuring longer-term swings in the market.
Figure 3: This long-term, weekly chart shows the transports retreating toward possible support at the 50-week exponential moving average. Upon examination of the transports and industrials on weekly charts with 50-week EMAs, what is immediately apparent is that both averages are moving swiftly toward those long-term moving averages. Will the 50-week EMAs provide support? Looking back on the way prices have moved above and below this moving average since the top in 2000, I doubt there is much reason to hope that declining prices will stop on a dime as soon as they hit 2760 (the level of the 50-week EMA for the transports) or 9775 (the level of the 50-week EMA for the industrials). While there has been some consolidation around the 50-week EMA over the past few years, there have been no instances since 1999 when a downtrend in the weekly industrials or transports was actually stopped by support at this level. The immediate test of support at the 50-week EMA will most likely come from the transports, and it would be no small bullish signal if the transports were in fact to find support at the 50-week EMA, rebound and challenge the current high for the move at 3090.
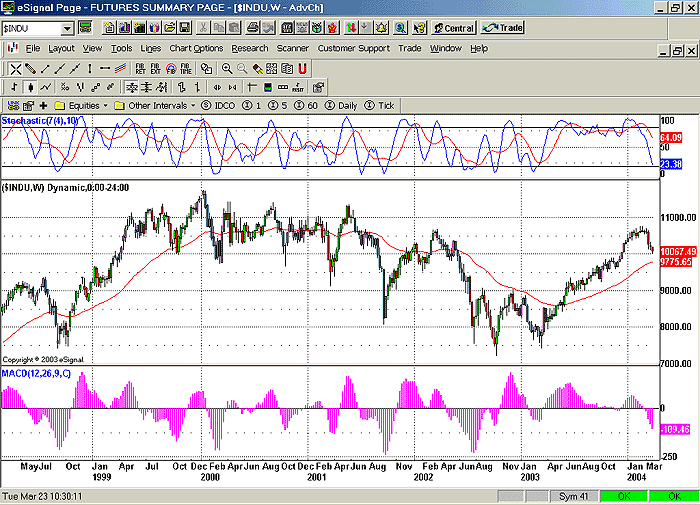
Figure 4: Significantly extended above the 50-week exponential moving average, the Dow industrials look ripe for further correction. Nevertheless, to underscore the bearishness of the current outlook on the Dow averages, even a cursory glance at the weekly charts since late 1998 reveals both averages to be significantly extended. In the transports, the move up from the 2003 low to the present one looks eerily similar to the move down from the 1999 high to the 2000 low. While there is no similar equivalent in the industrials, it is clear that this average was overdue for a correction of some significant degree. Whether this March correction will result in a resumption of the secular bear market or merely be an excellent buying opportunity for those playing the cyclical bull remains to be seen. The weekly charts of the industrials and transports suggest that the Dow averages are back in gear after a month of indecision and nonconfirmation. And for better or for worse, bull market or bear, most Dow theorists wouldn't have it any other way.
David Penn may be reached at DPenn@Traders.com.
Suggested readingEdwards, Robert D., and John Magee [2001]. Technical Analysis Of Stock Trends, 8th ed., W.H.C. Bassetti, ed. Saint Lucie Press.Penn, David [2004]. "Symmetrical Triangles And The MACDH," Working-Money.com: March 24. _____ [2004]. "Is March The Month For Higher Dow Highs?" Traders.com Advantage: March 2. _____ [2004]. "The Coming Confirmation?" Working-Money.com: February 4. Charts courtesy eSignal
Current and past articles from Working Money, The Investors' Magazine, can be found at Working-Money.com. |
Technical Writer for Technical Analysis of STOCKS & COMMODITIES magazine, Working-Money.com, and Traders.com Advantage.
| Title: | Traders.com Technical Writer |
| Company: | Technical Analysis, Inc. |
| Address: | 4757 California Avenue SW |
| Seattle, WA 98116 | |
| Phone # for sales: | 206 938 0570 |
| Fax: | 206 938 1307 |
| Website: | www.traders.com |
| E-mail address: | DPenn@traders.com |
Traders' Resource Links | |
| Charting the Stock Market: The Wyckoff Method -- Books | |
| Working-Money.com -- Online Trading Services | |
| Traders.com Advantage -- Online Trading Services | |
| Technical Analysis of Stocks & Commodities -- Publications and Newsletters | |
| Working Money, at Working-Money.com -- Publications and Newsletters | |
| Traders.com Advantage -- Publications and Newsletters | |
| Professional Traders Starter Kit -- Software | |
PRINT THIS ARTICLE

Request Information From Our Sponsors
- StockCharts.com, Inc.
- Candle Patterns
- Candlestick Charting Explained
- Intermarket Technical Analysis
- John Murphy on Chart Analysis
- John Murphy's Chart Pattern Recognition
- John Murphy's Market Message
- MurphyExplainsMarketAnalysis-Intermarket Analysis
- MurphyExplainsMarketAnalysis-Visual Analysis
- StockCharts.com
- Technical Analysis of the Financial Markets
- The Visual Investor
- VectorVest, Inc.
- Executive Premier Workshop
- One-Day Options Course
- OptionsPro
- Retirement Income Workshop
- Sure-Fire Trading Systems (VectorVest, Inc.)
- Trading as a Business Workshop
- VectorVest 7 EOD
- VectorVest 7 RealTime/IntraDay
- VectorVest AutoTester
- VectorVest Educational Services
- VectorVest OnLine
- VectorVest Options Analyzer
- VectorVest ProGraphics v6.0
- VectorVest ProTrader 7
- VectorVest RealTime Derby Tool
- VectorVest Simulator
- VectorVest Variator
- VectorVest Watchdog


