HOT TOPICS LIST
- Strategies
- Stocks
- Buy
- Investing
- Brokers
- Psychology
- Interviews
- Accumulate
- Sell
- Hold
- Spotlight
- Websites
- Candlestick Corner
- Gold & Metals
- Options Trading
LIST OF TOPICS
SECTOR SPOTTING
The '94 Rules
04/28/04 04:14:12 PM PSTby David Penn
Ten years ago, rising interest rates sent stocks and bonds reeling. What does the specter of higher interest rates in 2004 suggest about stocks going forward?
| If you've been paying any attention at all to the financial punditocracy these days, then it is likely that you've heard anxious references to 1994. Why 1994? Because it was in 1994 that many commentators and observers believe the Federal Reserve Board finally embarked upon a series of money and credit-tightening measures to tamp down an overheated economy. At the time, with the stock market moving upward in steady if not spectacular fashion in the wake of the Gulf War in 1991, the conventional wisdom was that rate hikes would not hurt a stock market — and an economy — that was fundamentally in good shape. With the stock market crash of 1987, the mini-crash of 1989, the savings & loan scandals, the recession of 1990-91, and the aforementioned Gulf War behind them, market participants who were then years into a new bull market could be forgiven their optimism. Unfortunately, as is often the case in the financial markets, optimism too long enjoyed is optimism for which a price must eventually be paid. As Jim Cramer, host of Jim Cramer's Real Money and founder of TheStreet.com, wrote in December 2003:
Let's get the setting right: As in 1994, we are coming into a year with a full head of Fed-stimulated boom . . . As in 1994, rates are way too low. As in 1994, the Fed said it wouldn't take precipitous action. Cramer, from his perspective as a consummate trader and investor, is not alone in his thinking that 2004 might play out according to the 1994 rules. Stephen Roach, the Morgan Stanley economist, has been supporting a similar reflection on history:
I definitely think it pays to heed the lessons of 1994. Back then, courtesy of a China boom and surging commodity prices, there was an inflation scare — but no inflation. There was also a central bank — America's Federal Reserve — that had to extricate itself from a policy of unusual accommodation. Market participants had been led to believe that the ensuing exit strategy would be painless and incremental. Yet 12 months and 300 basis points later, the bond market suffered unprecedented carnage. While the bond market was where the damage was most pronounced, the period also included a variety of financial debacles and scandals, some of which were connected in one way or another (though as often as not via derivative trading) to the shift in monetary policy in the United States from "easy" to "tight." Metallgesellschaft in 1993, Orange County in 1994, and Barings Bank and Daiwa Bank in 1995 were among the more widely reported financial implosions of the day. But one of the more confusing aspects of the period was the behavior of stocks. In retrospect, it seems most likely that traders and investors were cognizant of the relationship between rising interest rates and stocks in different sectors — some of which were more sensitive to interest rate changes than others. However, as commentator after commentator has written, the 1994 tightening period was characterized by a great deal of confusion as to what exactly the Federal Reserve was trying to do — and how long it was intent on doing it. As Roach's colleague at Morgan Stanley, Richard Berner, wrote:
First, and perhaps most important, neither market participants nor the public at large understood that low inflation wasn't low enough for a Fed bent on "opportunistic disinflation." The Fed's preemptive war on inflation was especially shocking, given that inflation and inflation expectations had both declined in the previous three years to 20-year lows with no sign of a quick rebound. To be sure, most understood that monetary policy early in 1994 was far from neutral, but few suspected that policy makers were prepared to go to a restrictive policy stance before inflation or inflation expectations had begun to rise. Cramer, looking specifically at sectors, speaks to the confusion of the time, as well:
The cyclicals went up because almost every time the Fed tightened, it said it was done tightening. That made it so you thought you had to bring in your shorts, which were all cyclical then. It is worth remembering that this was pre-"New Era" Alan Greenspan. The "serial bubble blower" Greenspan of the productivity revolution would not be born until well into the second half of the 1990s. At this point, the Fed chairman, as he did in 1996, was still more likely to warn of "irrational exuberance" in the stock market, and his exceptional hawkishness on inflation back in the early and mid-1990s was a true testament of this attitude.
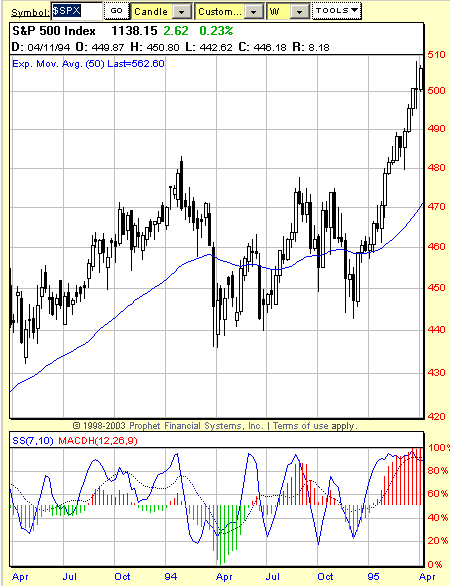
Figure 1: A largely sideways 1994 provided a pause for an S&P that had been in a solid ascent since the autumn of 1990.
Playing by the '94 rulesWhat are the "'94 Rules" when it comes to stocks and the stock market? The '94 rules refer to the period from July 1992, when the Federal Reserve lowered the Fed funds rate to 3%, through February 1994, when the Fed made the first of seven rate hikes, to July 1995, when the Fed reverted to an "easy credit policy." Essentially, the rising interest rate stock scenario doesn't simply suggest that some stocks will be hit when rates begin moving up, while others will be spared. On the initial news of higher rates (or even fears of higher rates), the market as a whole will likely take a hit. This, at least, is the "tell" provided by the market's late afternoon meltdown on April 20, 2004, when the Fed chairman informed Congress he was confident that:
Banks have made the most of the Fed's extremely low interest rates by providing all kinds of loans to consumers, especially mortgages. But as interest rates begin to move higher, banks have adapted their portfolio of assets and business plans to benefit from higher rates. "The hell you say," replied the markets — at least that's what they said on that Tuesday afternoon. In any event, the idea behind the "'94 rules" more concerns determining which stocks to buy after the market goes down for the eight-count when interest rates begin rising. Further, it is worth underscoring that a tightening of monetary policy is a process, even if it appears to be a series of isolated, discrete events. As Cramer noted, one of the things that made 1994 difficult was the perennial sense (in all likelihood encouraged by the Federal Reserve itself) that each tightening was the last. This probably prolonged the agony of those trying to hold on to stocks that not only would hit the canvas along with the rest of the market, but also failed to get up before the count of 10. Again, Cramer commented:
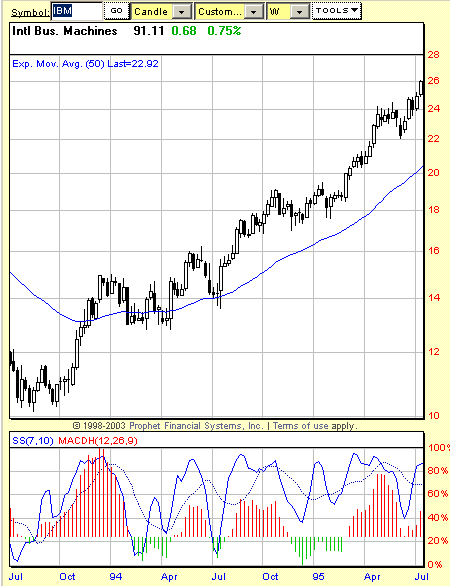
Through seven tightenings, the cyclicals kept climbing. Through seven tightenings, the retailers, the homebuilders, and the financials wilted. Through seven tightenings, we saw the drugs and the consumer nondurables stay stable and then ignite near the end of the tightenings. There is a problem with this, as Cramer himself acknowledges. In 1994, cyclicals rose in large part as a result of massive short-covering on the part of those traders who had been schooled on the commonsensical notion that a credit/liquidity-engineered economic slowdown was bad for cyclical companies and their stocks. It was the unwinding of these short positions that goosed cyclical stocks higher — over and over and over again during the period. It is hard to blame the shorts for getting squeezed. As Sam Stovall noted in his book, Standard & Poor's Guide To Sector Investing (and I should note that Cramer's and Stovall's definition of "cyclical" are somewhat at odds: Cramer considers cyclical companies what Stovall refers to as basic materials and capital goods. For Stovall, cyclicals are "consumer" cyclicals and include the very same retailers and homebuilders that people like Cramer are warning against), the chemical companies, the paper companies, the mining companies, the construction companies and so on tend to outperform very late in an economic expansion. When the economy is said to be "overheating," then this is one of the sectors from which a great deal of the smoke and fire is coming. Thus, if investors and traders believe that a contraction is coming, these peak-of-the-economic-expansion stocks would be among the first to be sold. A similar conundrum exists with regard to technology. While it is true that technology stocks did well in 1994, it is today apparent that technology was the growth sector of the 1990s — particularly the second half of the 1990s. In other words, there appears to have been a secular shift into technology investment in spending in the mid-1990s — not a shift caused by looser or tighter monetary policy but because of the inherent activity in the economy. This mid-1990s boom was not unlike the 1982-83 IPO boom in the PC market. Referring back to Stovall's discussion of sectors, we note that technology as a sector tends to outperform very early in an economic expansion — not when that expansion appears to be "overheating," much less when the Federal Reserve appears ready to slam on the brakes. Although 1994 was a year in which the Federal Reserve board made monetary policy tighter and tighter, consider the performance of stocks like Micron Technology (MU) and KLA-Tencor, both of which doubled over the year. Or of stocks like LSI Logic (LSI) which tripled. Teradyne (TER) and IBM were both up 30% and Microsoft (MSFT) was up some 60% over 1994. All of this occurred in a year during which the Dow Jones Industrial Average (DJIA) and Nasdaq both were essentially flat.
Figure 2: IBM's 30% gain in 1994 was an example of the performance of many stocks in the resurgent technology sector that year.
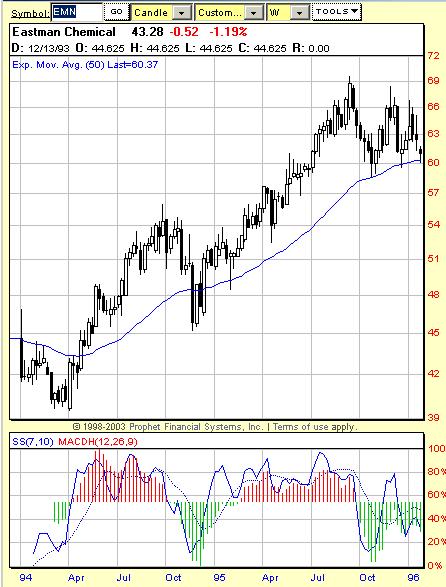
Trolling for sectorsHow about the other alleged all-stars of the '94 rules, such as the industrials or cyclical stocks (sticking with Cramer's definition of "cyclical")? While there were certainly winners and losers in this group in 1994, the performance of the winners is noteworthy. Alcoa (AA) was up 22% for the year. And chemical companies like Dow, Dupont (DD), Eastman Chemical (EMN), and Lyondell Chemical (LYO) were all up 30% or more in just the first three quarters of 1994, and all finished the year with double-digit gains.
Figure 3: Chemical companies like Eastman Chemical were among the biggest winners in 1994.
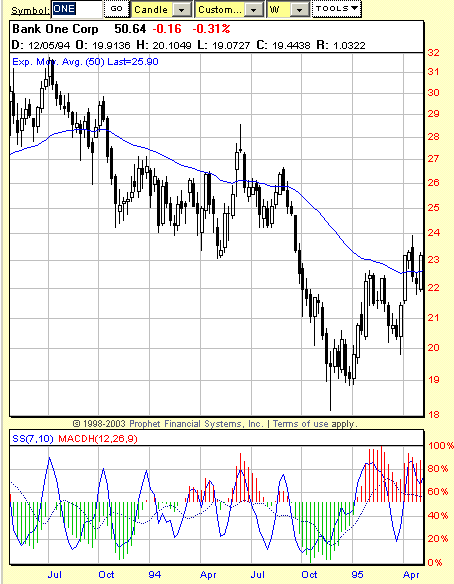
What about the alleged busts in retail and financials? Again, mixed bags were the order of the day — with retail winners in Ann Taylor (ANN) and Circuit City (CC). But the worst of the retail sector was truly bad indeed: Costco (COST) was down 25%, Dillards (DDS) down 28%, JC Penney (JCP) down more than 17%, Toys R Us (TOY) down 25% . . . even that retail thoroughbred Wal-Mart came up lame in 1994, crossing the finish line with a 16% loss for the year. Financials? Some fared better than others in 1994. At least half of the banks, for example, in the banking index ($BKX) were flat to slightly down. But consider the looks of the losers: Bank One (ONE) down 27%. PNC Financial Services (PNC) down 31%. Both KeyCorp (KEY) and Northern Trust (NTRS) were down 20% in 1994, and modern-day mortgage-lending stalwart Washington Mutual (WM) was down an ominous 36% for the year. What is especially noteworthy about the financials isn't the number of financial stocks that were down double digits in 1994, but the number of banks whose relative weakness made them easy prey for acquiring rivals. According to the testimony of Federal Reserve governor Laurence H. Meyer in 1998, there were more bank mergers and acquisitions in 1994 than in any year in the previous five. In fact, there were more bank mergers and acquisitions in 1994 than there were in any year between 1980 and 1997 save for the heyday of mergers & acquisitions activity in the late 1980s (1985, 1986, 1987, 1988).
Figure 4: While some financial stocks survived 1994, many — like Bank One — suffered steep corrections.
Even a cursory glance through the S&P 500 1994 Directory reveals a host of once-prominent finance corporations — from Corestates Financial and First Interstate Bancorp to Morgan Stanley and Salomon, Inc. — that today are parts of other, larger companies (First Union Bank, Wells Fargo, Dean Witter, and Travelers, respectively. First Union is now a part of Wachovia and Travelers is now a part of Citigroup). The surge in merger and acquisition in 1994 meant that many stronger financial companies saw value in the mixed fortunes of their competitors and moved to exploit additional growth strategies (such as merger) in a challenging environment. This "positivity" in the face of weakness was widespread. As Fortune magazine opined in July 1994 of the financial services sector:
Rising interest rates will cut the value of the commercial banks' securities holdings, surely, but most other aspects of the banking ledger look good. Says David Berry at Keefe, Bruyette & Woods: "Banks are extraordinarily healthy, almost too healthy — time to do some lending." Much of this health, it should be remembered, came courtesy of the low Fed funds rate and easy credit policies of the Federal Reserve in the years leading up to 1994. As Steven K. Beckner wrote in his book, Back From The Brink: The Greenspan Years:
Greenspan had been willing to hold the funds rate at 3% to help the banking industry recover. Now, thanks to the wide spread the Fed had maintained between banks' cost of funds and their lending rates, banks were coming back strong and were starting to lend aggressively into an expanding economy. Under these new conditions, he told both the administration and his Fed colleagues, a 3% funds rate was dangerously low. If a 3% funds rate in an era of 2.5% inflation (the Consumer Price Index (CPI) averaged about that between 1993 and 1995) was "dangerously low," then what can be said of a 1% funds rate in an era of 2% inflation (average monthly inflation rate since Fed funds lowered to 1% in June 2003)?
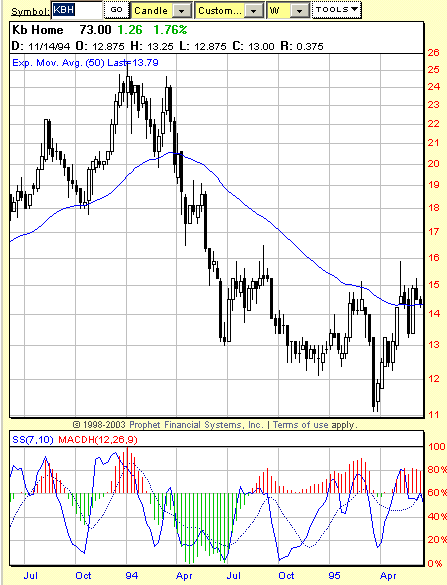
Betting the ranchAllegedly, if there is one group of unqualified losers per the '94 rules, it was the homebuilders. No other group benefits as disproportionately from a "dangerously low" interest rate environment as do the homebuilders, which rely on vigorous mortgage lending and refinancing activity to spur growth in their industry. Appropriately, if unfortunately, 1994 was especially cruel to the homebuilders: Beazer Homes (BZH) was down 34% for the year. Centex (CTX) down 43%. DR Horton (DHI) down 50%. KB Home (KBH) down 46%. Ryland Group (RYL) down 30%. Although many of the homebuilders corporations that have seen their stock appreciate tremendously in recent months were small (single and low double-digit) stocks in 1994, the damage they did to investor portfolios was certainly king-sized. Toll Brothers (TOL) was down 44%. Hovnanian (HOV) was down 67%.
Figure 5: The clear losers in 1994 were homebuilders. Hardly a single major homebuilder — such as KB Homes — emerged unscathed.
How well will the '94 rules play in 2004? One additional complicating factor is the question of whether the bear market from 2000 to 2002 is analogous to the bear market of 1990-91 — in terms both of what preceded it and what followed. Recall that the 1990-91 bear market served as a way station between the bull markets of the 1980s and the 1990s. This way of thinking suggests that in the same way the 1990-91 bear market divided the 1980s and 1990s bull markets, so might the 2000-02 bear market divide the 1990s bull market from the anticipated/hoped-for bull market of the first decade of the 21st century. In addition, the 1994 period happened after stock market investors had already enjoyed three years of gains off the bear market lows of 1991. By comparison, if 2004 is to resemble 1994, then investors will have only had a year or so to build up the sort of confidence a year like 1994 might test. At the beginning of 1994, the Standard & Poor's 500 was up 57% from its bear market lows in September 1990. At the beginning of 2004, the S&P 500 was up 45% from its bear market lows in October 2002. In 1994, investor memories of the crash of 1987, the S&L and insider trading scandals, the recession of 1990-91 and the Gulf War would likely have been crowded out by the more recent good news — including the odd outburst of good feelings and neighborliness worldwide. These outbursts were perhaps best characterized by a series of photographs depicting handshakes between such former antagonists as African National Congress leader Nelson Mandela and South African president F.W. de Klerk, and Israeli Prime Minister Yitzhak Rabin and PLO President Yasser Arafat, as well as cease-fire agreements in Northern Ireland and a successful summit between President Bill Clinton and Russian leader Boris Yeltsin. All of this took place in 1993. Contrast this with the recent history leading up to 2004: a hotly divided Presidential election, the bursting of an investment bubble, the worst act of terrorism on American soil, a continuing uneasiness in the wake of corporate scandal, and the invasion and occupation of an oil-rich Arab country. It is difficult, it not impossible, to render a verdict on the applicability of the '94 rules to the markets of 2004. As in 1994, there is a strange phobia about inflation. This phobia is not borne out by many traditional inflation measures such as CPI or the price of gold, which topped out at the beginning of April at about $430, but it is present enough in declining Treasury bond markets, advancing crude oil prices, and declining dollar values (to say nothing of asset inflation) to keep inflation fears well stoked. So much of what happened in 1994 seemed to be based on what market participants thought would happen, or should happen, as well as their frustrated and furious attempts to correct themselves as those initial suspicions proved wrong, that straightforward comparisons between the present market and the market 10 years ago may simply be untenable. There is one additional factor to keep in mind: 1994 was a year in which the major market averages were essentially flat, with pronounced weakness among certain stocks in certain sectors and industries. Is it possible that 2004 — rather than being merely flat — could actually turn out to be worse than 1994 was? To this notion, I consider the "reflation trade" of 2003 (see my Working Money article "The Reflation Trade"), and the potential unwinding of this trade in 2004. As Marc Faber of the GloomBoomDoom Report observes:
In the past, I have stressed that the year 2003 was unusual in the sense that every asset class including commodities, real estate, bonds in developed and emerging markets, as well as equities everywhere in the world increased in value . . . This was unusual since bull markets in one asset class are normally accompanied by bear markets in other asset classes . . . Therefore, it has been my view that in 2004 we would see diverging markets, with some asset classes rising, while others would decline. However, since Mr. Greenspan created a gigantic worldwide bubble in just about every imaginable form of assets, and because we had last year such a close connectivity between the different asset markets, in 2004, every asset class could also exhibit simultaneously downside volatility! David Penn may be reached at DPenn@Traders.com.
Suggested readingAversa, Jeannine [2004]. "2003 Inflation Rate Marks 43-Year Low, New Data Show," The Charleston Post and Courier, January 16.Beckner, Steven K. [1996]. Back From The Brink: The Greenspan Years, John Wiley & Sons. Berner, Richard [2004]. "2004 — Déjà Vu All Over Again?", Morgan Stanley Global Economic Forum: April 12. Cramer, Jim [2003]. "Worst Case For 2004: A Return To 1994," RealMoney.com: December 26. Faber, Marc [2004]. "Booming Commodity Prices, But " GloomBoomDoom.com: April 22. "Fed Chief Hints At Rate Hike" [2004]. CBSNews.com: April 21. Penn, David [2003]. "The Reflation Trade," Working Money: June 10. Prechter, Robert, Jr. [1999]. The Wave Principle Of Human Social Behavior And The New Science Of Socionomics, New Classics Library. Rhodes, Stephen A. [1996]. Mergers And Acquisitions By Commercial Banks, 1980-1994, staff study, Federal Reserve Board: January. Roach, Stephen [2004]. "Shades Of 1994," Morgan Stanley Global Economic Forum: April 12. S&P 500 1994 Directory, Volume 6 [1994]. McGraw-Hill. Stovall, Sam [1995]. Standard And Poor's Guide To Sector Investing, McGraw-Hill. "The Outlook For US Industries" [1994]. Fortune: July 25. Charts courtesy Prophet Financial Systems
Current and past articles from Working Money, The Investors' Magazine, can be found at Working-Money.com.
|
Technical Writer for Technical Analysis of STOCKS & COMMODITIES magazine, Working-Money.com, and Traders.com Advantage.
| Title: | Traders.com Technical Writer |
| Company: | Technical Analysis, Inc. |
| Address: | 4757 California Avenue SW |
| Seattle, WA 98116 | |
| Phone # for sales: | 206 938 0570 |
| Fax: | 206 938 1307 |
| Website: | www.traders.com |
| E-mail address: | DPenn@traders.com |
Traders' Resource Links | |
| Charting the Stock Market: The Wyckoff Method -- Books | |
| Working-Money.com -- Online Trading Services | |
| Traders.com Advantage -- Online Trading Services | |
| Technical Analysis of Stocks & Commodities -- Publications and Newsletters | |
| Working Money, at Working-Money.com -- Publications and Newsletters | |
| Traders.com Advantage -- Publications and Newsletters | |
| Professional Traders Starter Kit -- Software | |
PRINT THIS ARTICLE

|

Request Information From Our Sponsors
- StockCharts.com, Inc.
- Candle Patterns
- Candlestick Charting Explained
- Intermarket Technical Analysis
- John Murphy on Chart Analysis
- John Murphy's Chart Pattern Recognition
- John Murphy's Market Message
- MurphyExplainsMarketAnalysis-Intermarket Analysis
- MurphyExplainsMarketAnalysis-Visual Analysis
- StockCharts.com
- Technical Analysis of the Financial Markets
- The Visual Investor
- VectorVest, Inc.
- Executive Premier Workshop
- One-Day Options Course
- OptionsPro
- Retirement Income Workshop
- Sure-Fire Trading Systems (VectorVest, Inc.)
- Trading as a Business Workshop
- VectorVest 7 EOD
- VectorVest 7 RealTime/IntraDay
- VectorVest AutoTester
- VectorVest Educational Services
- VectorVest OnLine
- VectorVest Options Analyzer
- VectorVest ProGraphics v6.0
- VectorVest ProTrader 7
- VectorVest RealTime Derby Tool
- VectorVest Simulator
- VectorVest Variator
- VectorVest Watchdog

