HOT TOPICS LIST
- Strategies
- Stocks
- Buy
- Investing
- Brokers
- Psychology
- Interviews
- Accumulate
- Sell
- Hold
- Spotlight
- Websites
- Candlestick Corner
- Gold & Metals
- Options Trading
LIST OF TOPICS
THE CHARTIST
Chart Reading Basics
05/05/04 03:55:36 PM PSTby John Devcic
Reading charts, as you might have heard, is subjective. Here's how the novice can learn more about making it less so.
| Chart reading is a subjective art, with rules that govern pattern recognition. Chart reading also has abilities that chart readers feel can help pinpoint favorable market conditions. Here, I will introduce the terminology and some common patterns.
Charts, charts, chartsFirst of all, what is a price chart? A price chart is a sequence of prices plotted over a specific time frame. Technicians, technical analysts, and chartists use these charts to analyze an array of securities to forecast future price movements. Any security with price data stretching over a period of time can be used to form a chart for analysis. The less compressed the data is, the more detail that can be displayed. Before we get into some of the better-known patterns, let me tell you about the importance of trendlines and of support and resistance.
Trendlines A major aspect of technical analysis revolves around identifying and reading trendlines, based on the theory that prices trend. Trendlines have a dual purpose: trend identification and confirmation. A trendline simply connects two or more points on a chart for the purpose of identifying the movement of a security's underlying price. This same line can be used to extend into the future to form either the basis for support or resistance. ·Up trendline · These types of trendlines have an upward slope and are made by connecting two or more low points on a price chart. The second low must be higher than the first one for there to be an upward slope. As long as prices remain above the trendline, the uptrend is considered to be intact. Any break in the trendline usually signals that a change in the current trend is about to take place. ·Down trendline · As its name implies, this type of trendline has a downward slope, connecting two or more high points, with the second high lower than the first. As long as prices remain below the down trendline, the downtrend is solid. A break above the down trendline can indicate that a change of the current trend is forthcoming.
Support and resistance Support is not unlike a floor, the level at which point demand is thought to be strong enough to prevent the price from declining past that point. A decline past support points to an increase in the willingness of buyers to pay less, or that sellers do not feel further inclined to buy the security. Support levels are usually established below the current price, though it is not unusual to see a security trade at or near its support level. Resistance is not unlike a ceiling, the level at which point buying is not strong enough for the price to continue rising past that point. A break above resistance shows that buyers are willing to step in and buy the security. It is not unusual to see a security trade at or near its resistance level. Now, there are two major chart patterns, reversal and continuation patterns. Reversal patterns help the chart reader identify when a trend is reversing. Continuation patterns help chart readers identify strong trends. For this article, I want to focus on reversal patterns, as they are easier to identify for the novice chart reader.
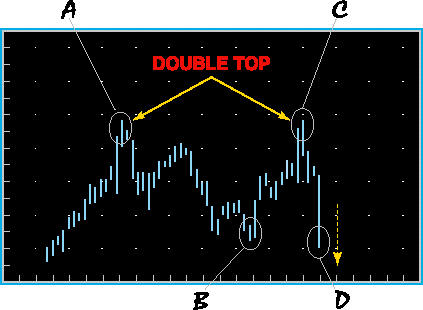
Reversal patternsDouble top (Figure 1) · This is one of the major reversal patterns, formed after a prolonged uptrend has been established. The double top is formed by two successive peaks approximately the same size on the chart with only a small downturn in between. This pattern usually signifies at minimum an intermediate change and quite possibly a long-term change in the trend (from bullish to bearish).
Figure 1: Double top.
It is not out of the ordinary to see more than one double top can be seen on the way up. Those other double tops are meaningless until key support (that is, the lowest point between the two peaks) is broken, because only then can a reversal be ensured. For best results, when looking for double tops it is best to wait for the peaks to have a separation of at least one month. The extra time will help identify a real change rather than just market resistance. One of the main mistakes made when reading this pattern is the tendency to move too quickly. Be patient and wait for the resistance to be broken.
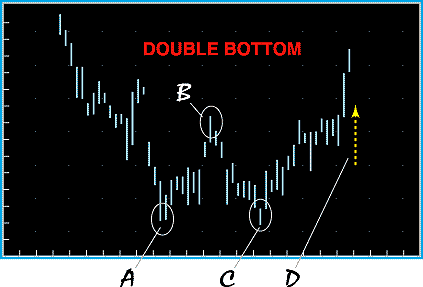
Double bottom (Figure 2) · This pattern is formed after a prolonged downtrend takes place. To identify the pattern on a chart, look for a bottom to take place, followed by a peak and another bottom of equal value as the previous one.
Figure 2: Double bottom.
The double bottom has also been called the W formation because it looks similar to the letter "W" on the chart. With few exceptions, this pattern usually signals an intermediate- to long-term change in the current trend. It is important to remember that this pattern will not be formed in a few days. You may see this formation in a few weeks; it is preferable to have at least four weeks between lows. Remember, bottoms usually take longer to form than tops. Just like with double tops, it is important to wait for the resistance breakout (the peak between the two bottoms) to confirm the change in the current trend.
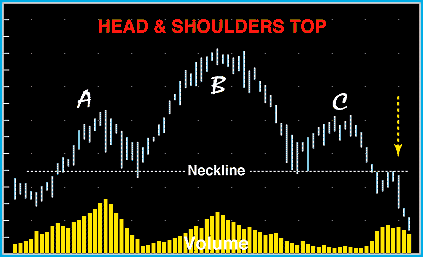
Head and shoulders top (Figure 3) · This pattern contains three consecutive peaks, with the centermost being the tallest of the three, also known as the head. This leaves the other two peaks to form the shoulders.
Figure 3: Head and shoulders top. The support line is drawn at the low point of each peak. During an uptrend, the first shoulder (left) will be crowned by a peak that represents the high of that current trend. Once the low of the left shoulder is formed, an upswing will begin that advances past the high set by the first shoulder. The peak of this new trend will form the head and a decline will begin. Usually, the decline will end around where the left shoulder was formed; this in turn will help form the neckline. The subsequent advance from the low of the head will start to form the right shoulder. You want to see this shoulder's top end at about the same place the left shoulder topped out. Do not look for perfect conformity between the shoulders peaks. The decline following the peak of the right shoulder should dip past the neckline. Keep an eye on the volume; you would like to see the volume higher during the construction of the first shoulder (left) than during the formation of the center peak (the head). Decisive confirmation can be found when volume goes up during the downtrend of the last shoulder.
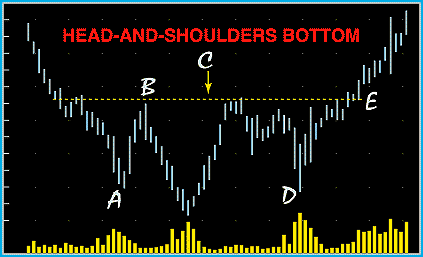
Head and shoulders bottom (Figure 4) · This pattern is sometimes referred to as an upside-down head and shoulders. The head and shoulders bottom forms after a downtrend. This pattern shares many of the same characteristics with the head and shoulders top; the major difference between the two is the reliance on volume. The head and shoulders bottom relies heavily on the volume for conformation. The pattern is formed by three dips, with the middle dip being the deepest.
Figure 4: Head and shoulders bottom.
Usually, the head or middle dip will resemble the letter "V." It is also important that the price moves past the neckline. In this case, the neckline is formed by the start and end of the head, or the V dip. There can be no reversal unless the neckline level is broken through. The head and shoulders bottom occur after a downtrend, and usually will mark a major trend reversal upon the completion of the right shoulder. The key to reading this pattern properly is to make sure that correct identification of the neckline resistance is made. The break through the neckline will signal the end of formation and be accompanied by strong volume.
The most famous of allAnd that is a brief introduction to the most famous chart patterns. These were all reversal patterns, which can become very handy in helping you make a decision regarding the future price of your stock. Only with diligent practice can you become proficient in chart reading. Chart reading is clearly an art form, but with practice and over time, these patterns can be identified quickly. Just keep reading charts, and after a while, it will become second nature. Used properly, chart reading can be an invaluable tool for the average investor to add to his or her repertoire of trading skills.
John Devcic is a market historian and freelance writer. He may be reached at glatko@aol.com.
Current and past articles from Working Money, The Investors' Magazine, can be found at Working-Money.com. |
John Devcic is a market historian and freelance writer. He may be reached at drmorgus@gmail.com
| E-mail address: | drmorgus@gmail.com |
PRINT THIS ARTICLE

Request Information From Our Sponsors
- StockCharts.com, Inc.
- Candle Patterns
- Candlestick Charting Explained
- Intermarket Technical Analysis
- John Murphy on Chart Analysis
- John Murphy's Chart Pattern Recognition
- John Murphy's Market Message
- MurphyExplainsMarketAnalysis-Intermarket Analysis
- MurphyExplainsMarketAnalysis-Visual Analysis
- StockCharts.com
- Technical Analysis of the Financial Markets
- The Visual Investor
- VectorVest, Inc.
- Executive Premier Workshop
- One-Day Options Course
- OptionsPro
- Retirement Income Workshop
- Sure-Fire Trading Systems (VectorVest, Inc.)
- Trading as a Business Workshop
- VectorVest 7 EOD
- VectorVest 7 RealTime/IntraDay
- VectorVest AutoTester
- VectorVest Educational Services
- VectorVest OnLine
- VectorVest Options Analyzer
- VectorVest ProGraphics v6.0
- VectorVest ProTrader 7
- VectorVest RealTime Derby Tool
- VectorVest Simulator
- VectorVest Variator
- VectorVest Watchdog


