

HOT TOPICS LIST
- Strategies
- Stocks
- Buy
- Investing
- Brokers
- Psychology
- Interviews
- Accumulate
- Sell
- Hold
- Spotlight
- Websites
- Candlestick Corner
- Gold & Metals
- Options Trading
LIST OF TOPICS
THE OPTIMIZED TRADER
Post-Breakdown MACDH Extremes
05/19/04 04:24:25 PM PSTby David Penn
Here's what the MACDH can tell you about breakout direction and breakdown intensity.
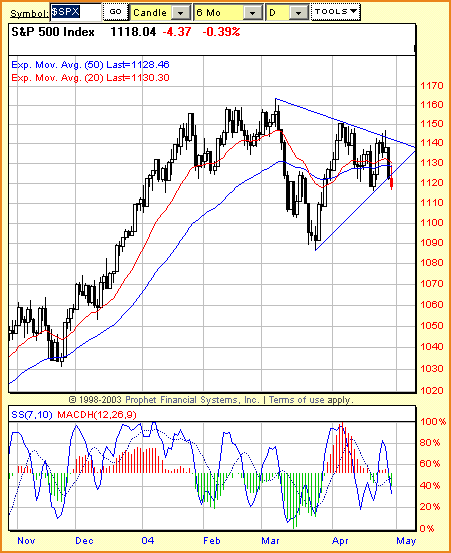
| Back in late April 2004, I noticed that the Standard & Poor's 500 had formed a largely symmetrical triangle out of its March and April price action. I didn't read or see too many technicians talking about it, but I knew that if ever there was a time that it would be nice to know the directionality of a symmetrical triangle, this would be it.
Figure 1: The resolution of this triangle should be definitive for the intermediate future of this market.
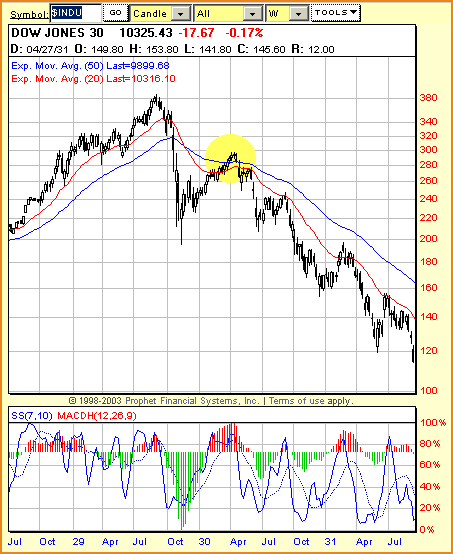
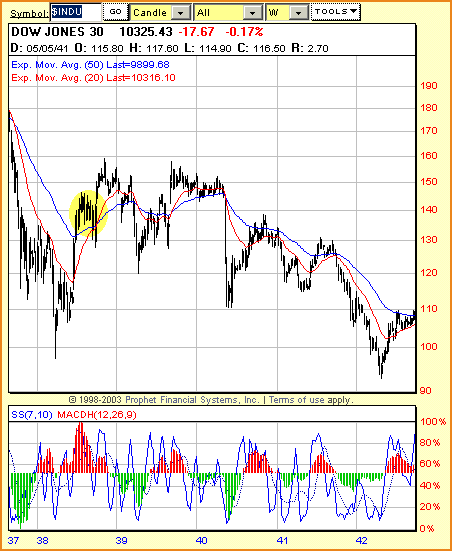
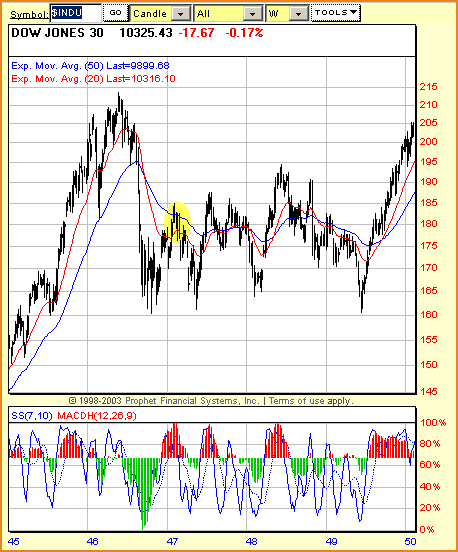
Given the size of the triangle, its breakout should be a significant event. With a formation size of approximately 70 points and a breakout level around 1130 (give or take five or so points), this triangle pointed to an initial upside move to 1200. . . or an initial downside move to 1060. Recent intraday price action underscored the latter possibility. The S&P 500 in late April was more prone to sudden, relentless moves to the downside than to aggressive rallies to the upside. This was particularly so in the late afternoon trading into the close. Eight of the 13 trading days leading up to April 29 saw the market sell off into the close — at times quite sharply. With the market moving lower over the balance of April, this contributed to a negative, anxious tone to the market as commentators scrambled to ascribe cause or blame (high interest rate fears, Iraq, al Qaeda, the Presidential elections, higher fuel prices, economic growth, trade deficits, the dollar, China, new corporate accounting scandals . . .). It should be underscored that this negative mood could prove fertile ground for, at minimum, a bounce in the S&P 500. The same could be said for an unwinding of short trades taken during either of the market's sellable rallies in late March or in late April. The surge in the moving average convergence/divergence histogram (MACDH) to the upside was not surprising in this context. I have written elsewhere that MACDH extremes often mark important turning points in markets — particularly in early bull markets, when MACDH extremes to the upside often portend an extended advance (consider the MACDH in the S&P 500 around mid-March 2003). But it also appears that extremely positive readings on the MACDH tend to occur in the first rally after a major decline. Consider the following charts of the S&P 500. Note these all use weekly MACDH values:
Figure 2: The crash of 1929 was characterized in part by the great bear market rally between November 1929 and April 1930.
Figure 3: Prices continued higher for a few more weeks after the positive MACDH extreme late in 1938. But the bear market from 1937-42 resumed shortly thereafter.
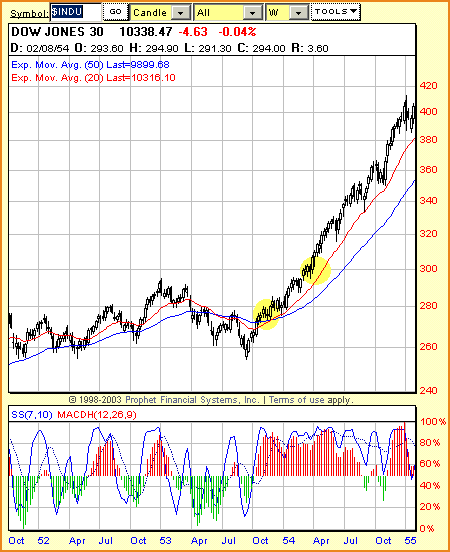
Figure 4: The positive MACDH extreme early in 1947 was followed by years of largely sideways action in the Dow Jones Industrial Average. This emphasizes the importance of price follow-through. While the MACDH extreme might alert traders (and long-term investors) to a significant opportunity, market participants would do well to remain cautious until price action confirms that the opportunity is real. At its most basic, this confirmation would come when the old lows (or old highs) are exceeded by new price action. With regard to the resolution of the March/April triangle in the S&P 500, the bullish case would seek a close above the March 2004 highs near 1160. Why not the April 2004 highs alone? Note how in Figures 3 and 4 the Dow Jones Industrial Average (DJIA) moved higher than its high during the previous positive MACDH extreme, only to move significantly lower shortly thereafter. In Figure 2, of course, prices rallied, but failed to take out the September 1929 peak. Compare these attempts to the one in 1954. Note that the 1953 peak (shown in Figure 5) was the culmination of a DJIA advance that began in the summer of 1949 (see Figure 4) and saw an appreciation of more than 80% from those lows.
Figure 5. It was not until the DJIA climbed above its 1953 pre-breakdown high of 295 in March 1954 that the positive MACDH extremes in the fall of 1953 and the spring of 1954 could be considered bullish.
At this point, it goes without saying that the S&P 500's close beneath the March 2004 lows was a major blow to the bullish case, establishing both new, significant lower highs as well as a significant new major low.
David Penn may be reached at DPenn@Traders.com.
Suggested readingElder, Alexander [2000]. Trading For A Living, John Wiley & Sons.Penn, David [2004]. "Symmetrical Triangles And The MACDH," Working Money: March 24. Charts courtesy Prophet Financial Systems
Current and past articles from Working Money, The Investors' Magazine, can be found at Working-Money.com.
|
Technical Writer for Technical Analysis of STOCKS & COMMODITIES magazine, Working-Money.com, and Traders.com Advantage.
| Title: | Traders.com Technical Writer |
| Company: | Technical Analysis, Inc. |
| Address: | 4757 California Avenue SW |
| Seattle, WA 98116 | |
| Phone # for sales: | 206 938 0570 |
| Fax: | 206 938 1307 |
| Website: | www.traders.com |
| E-mail address: | DPenn@traders.com |
Traders' Resource Links | |
| Charting the Stock Market: The Wyckoff Method -- Books | |
| Working-Money.com -- Online Trading Services | |
| Traders.com Advantage -- Online Trading Services | |
| Technical Analysis of Stocks & Commodities -- Publications and Newsletters | |
| Working Money, at Working-Money.com -- Publications and Newsletters | |
| Traders.com Advantage -- Publications and Newsletters | |
| Professional Traders Starter Kit -- Software | |
PRINT THIS ARTICLE

Request Information From Our Sponsors
- StockCharts.com, Inc.
- Candle Patterns
- Candlestick Charting Explained
- Intermarket Technical Analysis
- John Murphy on Chart Analysis
- John Murphy's Chart Pattern Recognition
- John Murphy's Market Message
- MurphyExplainsMarketAnalysis-Intermarket Analysis
- MurphyExplainsMarketAnalysis-Visual Analysis
- StockCharts.com
- Technical Analysis of the Financial Markets
- The Visual Investor
- VectorVest, Inc.
- Executive Premier Workshop
- One-Day Options Course
- OptionsPro
- Retirement Income Workshop
- Sure-Fire Trading Systems (VectorVest, Inc.)
- Trading as a Business Workshop
- VectorVest 7 EOD
- VectorVest 7 RealTime/IntraDay
- VectorVest AutoTester
- VectorVest Educational Services
- VectorVest OnLine
- VectorVest Options Analyzer
- VectorVest ProGraphics v6.0
- VectorVest ProTrader 7
- VectorVest RealTime Derby Tool
- VectorVest Simulator
- VectorVest Variator
- VectorVest Watchdog