HOT TOPICS LIST
- Strategies
- Stocks
- Buy
- Investing
- Brokers
- Psychology
- Interviews
- Accumulate
- Sell
- Hold
- Spotlight
- Websites
- Candlestick Corner
- Gold & Metals
- Options Trading
LIST OF TOPICS
TRADER'S NOTEBOOK
Trading Market Conditions
05/21/04 04:17:37 PM PSTby Steven Palmquist
Don't just diversify your instruments -- diversify your methods, too.
| As a full-time trader, I am often asked, "What is the key to successful trading?" This is like asking whether the liver or the heart is the more important part of the body. Just as your body needs more than one key organ to survive, there are many keys to trading success. Traders must master several different aspects of trading in order to succeed. This process will cost you in time, effort, and money. However, as with other professions, mastering trading is well worth the "tuition" you invest.
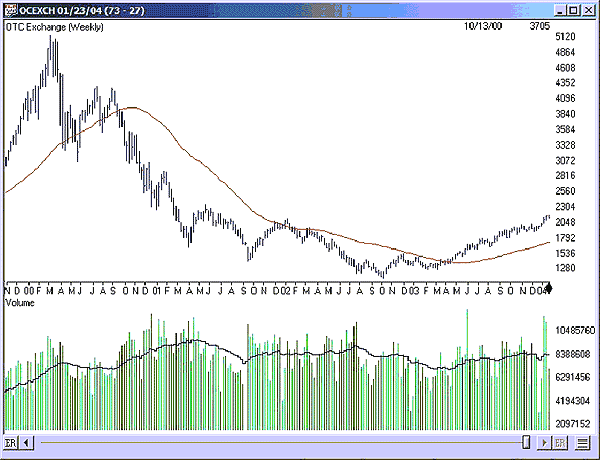
Analyzing market conditionsLearning to trade with the market is one of the keys to improving your trading results. Looking at Figure 1, it's clear that long-term strategies with holding periods measured in months were not the way to go during the 2000-02 period. However, there are some long-term strategies with short holding periods that worked during this period. In addition, there are a number of short-term strategies that worked during this period. Trading with the market requires you to develop a variety of strategies that will work in different market environments. You must also have a method for determining which strategy to use.
Figure 1: Nasdaq Composite three-year chart. Here you see an overlay of a moving average.
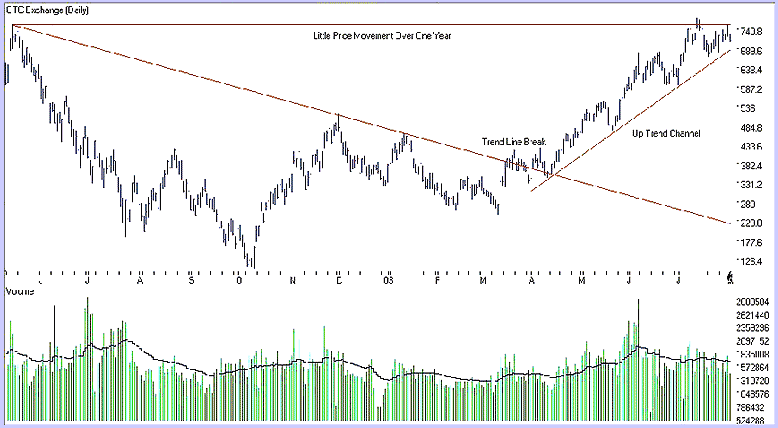
I have a dozen different scans that I run every evening, scans that look for long and short pullback setups, volume accumulation, volume distribution, and chart patterns. I have tested these scans in bullish, bearish, and trading-range (sideways) market periods, so I know which ones to use in a given market environment. These scans constitute my trading toolbox. Prior to trading, I analyze the market to determine which tool is right for the job. Analyzing market conditions is so important that I write down my observations each evening as I prepare for the next trading day. Along the way, I started sharing these observations with my friends, which encouraged me to focus on an objective look at the market. It is this process that eventually led to my publishing a newsletter. Whether or not you do the same, I encourage you to write down your analysis on the current market conditions every evening. Write a newsletter of sorts just for yourself. This process will improve your trading. Try not to be bullish or bearish: Just focus on where key support and resistance levels are, and what these levels imply for trading. If you decide you're bullish or bearish, you will have a tendency to find reasons to justify your position, especially if you follow the news. Instead, determine what type of market environment you're seeing, and what that implies about which of your trading tools should be used. I have found trendlines and moving averages on the Nasdaq Composite (Figure 1) to be effective for determining which trading tools to use. During backtesting, I have found that several of my trading systems respond well to limiting long entries to periods when the QQQ is above its 30-day simple average. I also use trendlines on the Nasdaq to determine whether to focus on long or short trades. Figure 2 shows a one-year period when the Nasdaq was basically unchanged. A long-term position trader would likely have broken even for the year. But when the Nasdaq was below the descending trendline, I focused on short setups for swing trades. When the Nasdaq broke the descending trendline, I began to focus more on long setups for swing trades. This is part of the process of selecting the best tool for the job.
Figure 2: Trading with Nasdaq trendlines. After the downward-sloping trendline broke, an uptrend was initiated. This would have been a setup for long trades.
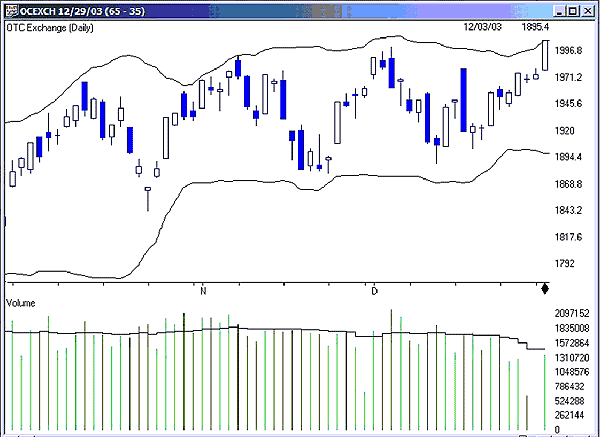
Figure 2 is a closeup of the area from May 2002 to July 2003 (shown in Figure 1). The first ascending trendline after the break is drawn through the lows in early April and late May 2003. As long as the Nasdaq was above this trendline, I continued to focus on long setups. The break of this trendline in early August caused me to stop taking long trades. A trendline break implies a change, which could mean a basing period or the beginning of a retracement. I do not begin taking short swing trades unless there is a lower low formed after a trendline break. The retracement of early August in Figure 2 did not form a lower low, so I redrew the upward-sloping trendline through the new low (as shown). This new trendline became one of the filters for determining whether to continue taking new long entries. When the market is in a clear trend (as shown in Figure 2), I generally use my tools for swing or intermediate-term trades. When the market is range-bound (as shown in Figure 3), I generally focus on short-term or swing trades. The pattern setups for all three types of trading are similar. The market conditions tell me which type of trading to do, and the type of trading determines the stop strategy.
Figure 3: Range-bound Nasdaq. This scenario is ideal for swing trades.
Matching trading techniques to market conditionsShort-term trading involves just playing the breakout period. Typically, I sell after one to three days, or a profit of $1.50 or 4%. This approach can be profitable in range-bound markets like the one seen in Figure 3, where longer-term trading just churns the account. Short-term swing trading involves placing an initial stop under the low of the setup pattern and trailing the stop as the trade moves up. This tends to work well when the market is trending. Intermediate-term trading starts with an initial stop under the low of the setup pattern and typically holds as long as market conditions remain favorable. I sell when the stock or the market breaks a key trendline or shows signs of topping. A range-bound market such as the one in Figure 3 is a good place to use short-term or swing trading techniques. In the third week of November, the market was retesting the recent low set in late October. This type of situation can provide a reasonable-risk entry for new long setups if the market shows a clear bounce off the lows, as it did with the large white candle in the fourth week of November. The risk is reduced because if the bounce fails, and the market drops below the support level of the previous four bars, this signals that the market was not ready to move to the top of the range. Long trades may then be exited quickly. It is usually best to trade with the market trend. As the market approached the recent high (early November, Figure 3), short-term traders would consider exiting long positions in case the market retraces from the retest of recent highs. The short-term trader locks in profits as a range-bound market approaches resistance. He or she then prepares to trade either the short side if the market bounces off resistance, or the long side again if the market breaks through the resistance level. When the market is in an extended basing period, this can be an effective technique. Eventually, the market will break out of a basing area, providing another reasonable-risk entry in the direction of the break. The risk is reduced because if the market should retrace and reenter the basing area, a false breakout may be assumed and trades can be closed quickly. A breakout from a basing area is often a good time to move from short-term trading to swing or intermediate-term trading. Intermediate-term trading techniques are best used when the market is in a clear trend. New trends often start with the break of an intermediate- or long-term trendline, or a successful retest of a base breakout. In such instances, you may want to consider swing trading until the market has established a higher low. After a higher low is established, use it to draw a trendline and consider intermediate-term trading techniques until the trendline is broken. The break of the descending trendline in Figure 2 took a few weeks for the market to sort out. This is one reason that I don't promptly start intermediate-term trading when a trendline is broken by a point or two. To use intermediate-term trading rules, the trend must be clear, which is usually not the case until a higher low has been established. From the time of the trendline break until a higher low is formed, consider using short-term or swing trading techniques. Once a higher low has been formed (see mid-May in Figure 2), a trendline can be drawn and used to determine when to close intermediate-term trades. These techniques are not exclusive. Uptrends will frequently form channels where both intermediate- and short-term trading techniques may be used. Short-term trading in a channel involves entering longs as the market bounces off the bottom of the channel, and closing them as the market approaches the upper channel boundary. Short-term short positions may be established as the market bounces off the top of the channel and returns to the lower channel boundary. Countertrend shorting is for the experienced trader, and should be very short term.
SummaryThe market is a strong force that influences the outcome of most trades. Taking all trades generated by a system regardless of market conditions will likely give you lots of practice at taking drawdowns and stop-losses. Developing different systems that test well for bull, bear, and sideways markets and selecting the right tool for the current market conditions can improve your results. Rather than focusing on short-, intermediate-, or long-term trading, consider developing expertise in all three and letting market conditions determine which set of rules to use.
Steve Palmquist is a full-time trader with nearly 20 years of experience. He is the founder of www.Daisydogger.com, which provides free market analysis, trading tips, and educational material, including the Timely Trades newsletter. If you are interested in his newsletter or in the code for the trading systems mentioned here, please email Palmquist at code@daisydogger.com.
Suggested readingPalmquist, Steve [2004]. "Trading Pullbacks In Trends," Working Money: February 4.·More information on swing trade setups and stop-loss techniques may be found at: Charts courtesy AIQ Charts
Current and past articles from Working Money, The Investors' Magazine, can be found at Working-Money.com. |
| Website: | www.daisydogger.com |
PRINT THIS ARTICLE

Request Information From Our Sponsors
- StockCharts.com, Inc.
- Candle Patterns
- Candlestick Charting Explained
- Intermarket Technical Analysis
- John Murphy on Chart Analysis
- John Murphy's Chart Pattern Recognition
- John Murphy's Market Message
- MurphyExplainsMarketAnalysis-Intermarket Analysis
- MurphyExplainsMarketAnalysis-Visual Analysis
- StockCharts.com
- Technical Analysis of the Financial Markets
- The Visual Investor
- VectorVest, Inc.
- Executive Premier Workshop
- One-Day Options Course
- OptionsPro
- Retirement Income Workshop
- Sure-Fire Trading Systems (VectorVest, Inc.)
- Trading as a Business Workshop
- VectorVest 7 EOD
- VectorVest 7 RealTime/IntraDay
- VectorVest AutoTester
- VectorVest Educational Services
- VectorVest OnLine
- VectorVest Options Analyzer
- VectorVest ProGraphics v6.0
- VectorVest ProTrader 7
- VectorVest RealTime Derby Tool
- VectorVest Simulator
- VectorVest Variator
- VectorVest Watchdog


