

HOT TOPICS LIST
- Strategies
- Stocks
- Buy
- Investing
- Brokers
- Psychology
- Interviews
- Accumulate
- Sell
- Hold
- Spotlight
- Websites
- Candlestick Corner
- Gold & Metals
- Options Trading
LIST OF TOPICS
Copper: Recessions, Cycles, And Spins
06/02/04 04:48:37 PM PSTby David Penn
Can the economy keep counting on copper?
| With all the attention currently paid to commodities like gold and crude oil, and the accompanying questions about what the rise and fall in the prices of these commodities might mean for the broader economy, one important commodity appears to be left out of the discussion: copper. What's the big deal about copper, you ask? Copper played a pivotal role in the prehistoric transition from stone culture to and through metal culture (the "Copper Age" was followed by a "Bronze Age," which came about as the result of mixing copper with tin to produce a stronger, superior metal). Today, copper plays a major role in the modern economy — from piping and wiring to electric circuitry — although, more often than not, copper's role is a supporting one in these applications, as opposed to a leading one. Nevertheless, the breadth of copper's application in the industrial and post-industrial economy makes it no less sensitive to hopes and fears about the economy than other commodities. For example, technical analyst, author, and intermarket expert, John J. Murphy observed in his book, Intermarket Technical Analysis, that:
Because copper is used in the automotive, housing, and electronics industries, a lot can be learned about the strength of the economy by studying the strength of the copper market. During periods of economic strength, demand from the three industries just cited will keep copper prices firm. When the economy is beginning to show signs of weakness, demand for copper from these industries will drop off, resulting in a declining trend in the price of copper. In the four recessions since 1970, the economic peaks and troughs have coincided fairly closely with the peaks and troughs of the copper market. Murphy is hardly the only one to note the relationship between copper prices, the stock market, and the economy. Author and Elliott wave theorist Robert Prechter says this of copper and economics, writing in his book, At The Crest Of The Tidal Wave:
The price of copper always rises during an economic expansion, and a peak in its price almost always precedes an economic contraction . . . The correlation is striking on the short term, but also on the long term. During the major (copper) bear market of 1864-1933, there were many recessions, while in the (copper) bull market that has been in force since then, there have been very few. Notice that even during its long bear market, copper's few advances came during economic expansions. And later:
The pattern in copper over the past 15 years has been similar to, but slightly different from, that of 1916-1929, which preceded the last depression. While the inflationary peak of 1916 led to a drop and a two-step rise to a lower high in 1929, the inflationary peak of 1980 has led to a drop and a two-stop rise that may end at a higher high. Regardless of this difference, the recessions that accompanied the two pullbacks of 1920-21 and 1927 in the previous era correspond to the recessions that accompanied the pullbacks of 1980-82 and 1989-1992 in the current era. Combining these observations that copper peaks often augur peaks in economic activity could provide analysts, investors, and traders with a powerful tool to anticipate not only major moves in copper prices but, potentially, major moves in the economy, as well. The question of the moment, then, is how do Prechter's and Murphy's separate analyses relate to current price action with regard to copper? The commodity has been in a major bull market since the autumn of 2001, and now in the late spring of 2004 appears to have topped out at a level — namely $1.40 per pound — that has historically proved to be stiff resistance.
The spinBefore answering the question of what copper peaks represent, we first need to establish that copper has indeed peaked on at least an intermediate-term basis. To do this, we turn first to the spin, or the psychology of those watching the copper market over the past few years — a period during which copper prices soared from just over 60 cents a pound to nearly 140 cents a pound. Much of the pro-copper psychology has derived from three main investment themes: China's growing demand for commodities, the housing boom in the United States and England, and the zero-interest financing of expensive automobiles such as SUVs. Given what Murphy tells us about copper demand, it is little surprise that the bullish "story" on copper would consist of, at a minimum, these three chapters. The China angle has been perhaps the most pronounced, with gold bugs and emerging-markets investors alike positively atwitter about the inflationary possibilities and implications of the eye-popping growth of the Chinese economy. These excerpts from a recent Forbes story on China are exemplary of the sort of enthusiasm "the China Rules" (that is, whoever rules China makes the rules — at least economically — that the world will follow) elicit. The quoted sections are from Timothy Snider, president and CEO of Phelps Dodge Corp., the world's second largest copper miner.
Back in the United States, the housing boom was also among those factors credited for driving copper prices higher. Fairly typical was this commentary from a housing industry-oriented website, homeboundmortgage.com:
Copper Has Biggest Gain in Month on Report of Surge in US Housing Starts And this from USA Today:
Higher materials prices hit buildersAnd this from the Salt Lake City Tribune:
Copper joins with pricey commoditiesFinally, the relationship between copper prices and automobile sales is one that has been covered not only by the financial media, but also by technical and intermarket analysts like John Murphy who, looking at the bear market period between 1989 and 1990, observed that:
Copper futures also showed a strong correlation with automobile stocks in the nine months from mid-1989 through the first quarter of 1990. The automobile industry is one of the heaviest users of copper, and their fortunes are often tied together. How tight has this relationship held up in recent years? As measured by the Auto Major Manufacturers Index, automakers hit significant lows in mid-2001 and again in early 2003. We know that copper prices made a major low in mid-2001, a major three- and nine-year cycle low, at that. And while the first few months of 2003 saw relatively low copper prices, there was no particularly cyclical low in copper at that time. Perhaps especially noteworthy is how both copper prices and the Auto Major Manufacturers Index appear to have topped within days of each other in 2004, with the index topping on March 1 and copper prices (basis continuous futures) topping on March 2. The cycles Many of the best arguments underscoring the possibility of a top in copper prices comes from cyclical analysis. One such analyst, Tim Wood of Cyclesman.com, recently compiled a fascinating study of metals' cycles since 1970, with a particular eye toward putting in context the recent bullish moves in gold, silver, and copper. What is the point of studying cycles? Writing in Technical Analysis of STOCKS & COMMODITIES magazine (November 2001), Wood notes that:
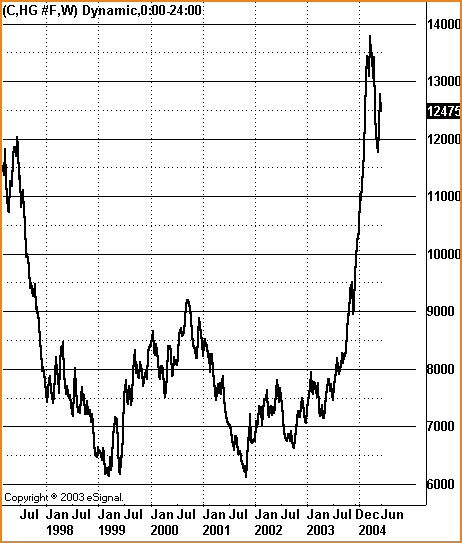
Usually, the effect of cycles is of only passing interest to market analysts and traders, unless the cycles in question are related to market prices and can be used to identify tops and bottoms of price movement and give indications of future price activity . . .In other words, cycles provide some anticipatory tools for analysts and traders that not only enable them to take superior risk/reward opportunities as market participants, but also the relationship between cycles and what Wood calls "fundamental information" is such that analysts can begin to infer likely fundamental outcomes based on the status of the prevailing cycle. These fundamental outcomes may be as mundane as a government crop report or as key as the relative prosperity (or lack thereof) of a given economy. So what does Wood's work suggest about the likelihood that copper is topping in the second quarter of 2004? Wood's report, "A Special Analysis Of The Gold Market," observes that copper shares with gold both a three-year and a nine-year cycle. Tellingly, copper reached both a three-year and a nine-year cycle low with the declines of the fourth quarter of 2001 (Figure 1). The previous three-year cycle low in copper was in 1999, and the previous nine-year cycle low in copper was the 1993 correction.
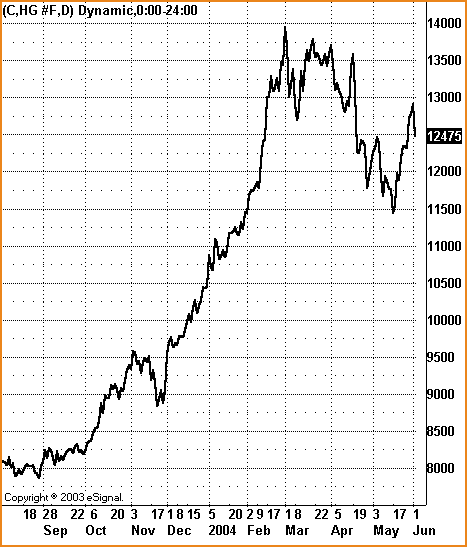
Figure 1: The copper trough in 1999 may or may not have signaled the slowdown two years later. But there's no doubt that the trough late in 2001 arrived right in the middle of the turn-of-the-millenium recession. As you can see, cycles are occasionally off the mark by a few months. Nevertheless — and especially when dealing with cycles running nine-years — these few months have yet to throw off a cycle by a significant margin. At a minimum, a copper investor or trader recognizing a nine-year low in 1993 — or a three-year low in 1999 — would hardly have been harmed by expecting a buying opportunity in 2002, only to have that opportunity arise a few months sooner in late 2001. In any event, Wood's locating of a three-year cycle low in copper in 2001 suggests strongly the possibility of a following three-year cycle low in 2004 (Figure 2). And given the fact that copper has been in a strong bull market since the last now-clear, three-year cycle low in 2001, it would be reasonable to expect that the coming correction in copper as it retreats from its 2004 highs near $1.40 will represent that three-year cycle low.
Figure 2: Does this peak in copper prices in 2004 anticipate a three-year cycle low scheduled for later in the year?
A good question at this point is: How low is low? While Wood's article points to a number of ways of determining the extent of cyclical declines (those interested are strongly encouraged to contact Tim Wood at Cyclesman.com), it suffices here to note that previous three-year cycle lows following three-year cycle lows that were also nine-year cycle lows have varied. In one instance, in the 1970s, subsequent three-year cycle lows remained above the low of the simultaneous three-year/nine-year cycle lows (that is, the 1980 and 1977 three-year lows were higher than the three and nine-year cycle low in 1975). In another instance, in the 1990s, the initial three-year cycle low following the simultaneous three-year/nine-year cycle low was higher, but the three-year cycle low after that turned out to be lower (that is, the 1996 low was higher than the 1993 low, but the 1999 low was lower than both the 1996 and 1993 lows). But if the question "How low is low?" cannot be easily answered, the point should be underscored that the declines from copper peaks have tended to be significant. The 1980 peak between the nine-year cycle lows of 1975 and 1984 saw copper rally from approximately 50 cents to approximately 140 cents and back down to about 60 cents. The 1988-89 peak between the nine-year cycle lows of 1984 and 1993 saw copper rally from approximately 60 cents to almost 160 cents before falling to about 75 cents. And the 1995 peak between the nine-year cycle lows of 1993 and 1999 saw copper move from about 75 cents to about 145 cents and back down to about 60 cents. If this pattern holds, then the decline from the 2004 copper peak could easily cut copper prices in half, returning them to the 75- to 65-cent range or lower by the next nine-year cycle low (scheduled for 2010).
The recessionsOkay, so copper makes troughs and copper makes peaks. But do copper peaks anticipate recessions? Per Prechter's count, the scorecard is noteworthy:
Copper peaks/Recessions
From here, there are two additional copper peak/recession pairs — the 1988 copper peak and the 1990-91 recession, and the 1994-95 copper peak and the bear market of 1994. In some ways, these latter two instances are less perfect fits: The 1988 copper peak was followed by a recession. But that recession was at least two years afterward. By some measurements, there was a bear market in stocks between 1988 and 1991 (both the mini-crash of 1989 and the performance of "average" stocks during that period underscore the argument for a bear market — even if the 1990-91 recession was both "late" and moderate). This may be all the more the case with regard to the 1994-95 copper peak, which was accompanied by a bear market in stocks in 1994. What about the more recent peaks and troughs in copper? Neither of the three-year cycle lows in copper in 1996 nor 1999 produced or accompanied a recession. But it seems evident that the three- and nine-year cycle low in 2001 did. Copper peaked in mid-2000 and bottomed in the third quarter of 2001. The National Bureau of Economic Research (NBER) made its official determination that the 2001 recession began in March 2001. Copper prices spent most of 2002 consolidating with a slightly bullish bias, while stocks topped early in the year, plunged into the third quarter, and began rallying toward year's end. After early bearishness, 2003 was a banner year for stocks, the economy, and — appropriately enough — copper prices. Given this, it is hard not to wonder whether, after a year of broad-based gains in everything from stocks and bonds to gold and real estate, a reversal of fortunes may be in store for those investors and traders who hoped last year's strategies would win this year's battles. While it may turn out that copper prices weren't the first to indicate otherwise, traders and investors will find it difficult to avoid the plunging copper price's signal if the current correction continues.
David Penn may be reached at DPenn@Traders.com.
Suggested reading"Copper has biggest gain in month on report of surge in US housing starts" [2004]. Bloomberg, from HomeBoundMortgage.com: April 16.James, Steve [2004]. "China seen rivaling world mining powers in future," Reuters, from Forbes: May 24. Kirchhoff, Sue [2004]. "Higher materials prices hit builders," USA Today: March 29. Murphy, John [1991]. Intermarket Technical Analysis, John Wiley & Sons. Oberbeck, Steven [2004]. "Copper joins with pricey commodities," The Salt Lake Tribune: March 19. Prechter, Robert [1995]. At The Crest Of The Tidal Wave, John Wiley & Sons. Wood, Tim [2004]. "A special analysis of the gold market," Cycles News & Views (http://www.cyclesman.com): April. _____ [2001]. "What Can Market Cycles Tell Us?" Technical Analysis of Stocks & Commodities, Volume 19: November. eSignal Current and past articles from Working Money, The Investors' Magazine, can be found at Working-Money.com. |
Technical Writer for Technical Analysis of STOCKS & COMMODITIES magazine, Working-Money.com, and Traders.com Advantage.
| Title: | Traders.com Technical Writer |
| Company: | Technical Analysis, Inc. |
| Address: | 4757 California Avenue SW |
| Seattle, WA 98116 | |
| Phone # for sales: | 206 938 0570 |
| Fax: | 206 938 1307 |
| Website: | www.traders.com |
| E-mail address: | DPenn@traders.com |
Traders' Resource Links | |
| Charting the Stock Market: The Wyckoff Method -- Books | |
| Working-Money.com -- Online Trading Services | |
| Traders.com Advantage -- Online Trading Services | |
| Technical Analysis of Stocks & Commodities -- Publications and Newsletters | |
| Working Money, at Working-Money.com -- Publications and Newsletters | |
| Traders.com Advantage -- Publications and Newsletters | |
| Professional Traders Starter Kit -- Software | |
PRINT THIS ARTICLE

Request Information From Our Sponsors
- VectorVest, Inc.
- Executive Premier Workshop
- One-Day Options Course
- OptionsPro
- Retirement Income Workshop
- Sure-Fire Trading Systems (VectorVest, Inc.)
- Trading as a Business Workshop
- VectorVest 7 EOD
- VectorVest 7 RealTime/IntraDay
- VectorVest AutoTester
- VectorVest Educational Services
- VectorVest OnLine
- VectorVest Options Analyzer
- VectorVest ProGraphics v6.0
- VectorVest ProTrader 7
- VectorVest RealTime Derby Tool
- VectorVest Simulator
- VectorVest Variator
- VectorVest Watchdog
- StockCharts.com, Inc.
- Candle Patterns
- Candlestick Charting Explained
- Intermarket Technical Analysis
- John Murphy on Chart Analysis
- John Murphy's Chart Pattern Recognition
- John Murphy's Market Message
- MurphyExplainsMarketAnalysis-Intermarket Analysis
- MurphyExplainsMarketAnalysis-Visual Analysis
- StockCharts.com
- Technical Analysis of the Financial Markets
- The Visual Investor