HOT TOPICS LIST
- Strategies
- Stocks
- Buy
- Investing
- Brokers
- Psychology
- Interviews
- Accumulate
- Sell
- Hold
- Spotlight
- Websites
- Candlestick Corner
- Gold & Metals
- Options Trading
LIST OF TOPICS
TRADER'S NOTEBOOK
Understanding McClellan's Oscillator & Summation Index
06/09/04 03:48:31 PM PSTby John Devcic
Comprehending the markets should start with understanding how these stalwart indicators are calculated.
| If you have ever watched a financial markets-related show or read a publication that covers the markets, you have probably come across a set of numbers referred to as the McClellan oscillator and summation index. Have you ever wondered what these numbers meant and who came up with them? In 1969, Sherman and Marian McClellan created both the McClellan oscillator and the McClellan summation index. Since the introduction of these indicators, they have proven to be valuable tools with which to spot overbought or oversold markets. The McClellan oscillator is based on the overall movements of a particular exchange. Most of the time, that exchange is the New York Stock Exchange (NYSE). The oscillator is a market breadth indicator that is based on the smoothed difference between the advancing and declining issues of the NYSE. Note that the oscillator is not calculated using any single individual stock or security. The summation index is a total of the daily McClellan oscillator readings. Before I delve into the McClellan oscillator and summation index, I'll go over the meaning of market breadth. On financial-news television stations and in many publications that cover the markets, you will be able to find a list of the number of advancing and declining stocks of a particular market on any given day. The difference between the number of advancing stocks and the number of declining stocks make up the market's daily breadth. To properly identify a trend in the breadth, we need to smooth out the numbers by using a calculation known as the exponential moving average (EMA). Essentially, this calculation weighs the most recent data more heavily versus older data. The amount of weight given to the more recent data is known as the smoothing constant.
The formulaThe McClellan oscillator is an indicator derived from each day's net advances, from the number of advancing issues minus the number of declining issues. Subtracting the 19-day exponential moving average from the 39-day exponential moving average is the formula that makes up the McClellan oscillator:
(10% EMA of advances - declines) - (5% EMA of advances - declines)
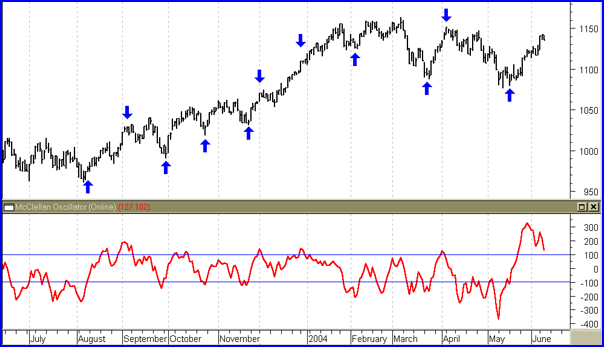
Overbought/oversold indicationsThe McClellan oscillator can produce buy and sell signals as well as identify overbought and oversold situations (Figure 1). Readings usually above +100 are thought to be overbought and readings below -100 are thought to be oversold. Buy signals are generated when the oscillator advances from oversold levels into positive territory.
Figure 1: The McClellan oscillator. Readings above +100 indicate overbought conditions and readings below -100 are considered oversold conditions.
On the other hand, sell signals are generated on declines from an overbought situation to negative territory. I find it easy to remember that generally, the oscillator will have a positive number when there is money coming into the market. Of course, when the oscillator is negative, it means money is leaving the market.
The summation indexThe McClellan summation index is a total of the daily McClellan oscillator readings. It can be calculated in one of the two following ways:
Calculation 1: Summation index = McClellan oscillator - ((10 * 10% trend) + (20 * 5% trend)) + 1000
5% trend is the 5% EMA of (advancing - declining issues) and 10% trend is the 10% EMA of (advancing - declining issues)
Calculation 2: Summation index = Yesterday's summation index + McClellan oscillator
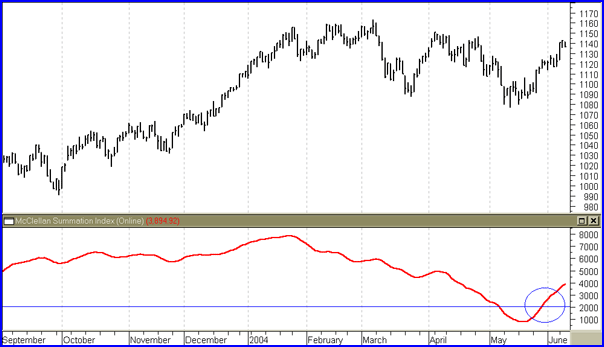
When properly calculated, the summation index is neutral at the +1000 level. The index indicates that an unusual condition is taking place in the market. Further, the summation index can signal the end of a bear market. Bear markets will typically end when the index has a reading of -1200. A strong upward move from this level can signal the start of a new bull market. For confirmation of a move like this one, look for the index level to rise above +2000 (Figure 2).
Figure 2: Is this the start of a new bull market? On the chart of the S&P 500, the McClellan summation index is rising above +2000. This may be something to keep an eye on.
SummaryThe McClellan oscillator is a simple way for both market professionals and individual investors to have a barometer of current market conditions. Remember, the McClellan oscillator and summation index are not calculated by using individual stocks or securities; it is an exchange-wide indicator. It measures both market conditions as well as market sentiment. While it is mainly used on the NYSE, it can be used on any market. Using its signals can be a valuable tool in an individual investor's toolbox. On a final note, Sherman McClellan and his late wife, Marian, were presented with a Lifetime Achievement Award by the Market Technicians Association (MTA) at its annual conference in Marco Island, FL, on May 14, 2004.
John Devcic is a market historian and freelance writer. He may be reached at glatko@aol.com.
Suggested readingDevcic, John [2004]. "Chart Reading Basics," Technical Analysis of Stocks & Commodities, Volume 22: August.Current and past articles from Working Money, The Investors' Magazine, can be found at Working-Money.com.
|
John Devcic is a market historian and freelance writer. He may be reached at drmorgus@gmail.com
| E-mail address: | drmorgus@gmail.com |
PRINT THIS ARTICLE

Request Information From Our Sponsors
- StockCharts.com, Inc.
- Candle Patterns
- Candlestick Charting Explained
- Intermarket Technical Analysis
- John Murphy on Chart Analysis
- John Murphy's Chart Pattern Recognition
- John Murphy's Market Message
- MurphyExplainsMarketAnalysis-Intermarket Analysis
- MurphyExplainsMarketAnalysis-Visual Analysis
- StockCharts.com
- Technical Analysis of the Financial Markets
- The Visual Investor
- VectorVest, Inc.
- Executive Premier Workshop
- One-Day Options Course
- OptionsPro
- Retirement Income Workshop
- Sure-Fire Trading Systems (VectorVest, Inc.)
- Trading as a Business Workshop
- VectorVest 7 EOD
- VectorVest 7 RealTime/IntraDay
- VectorVest AutoTester
- VectorVest Educational Services
- VectorVest OnLine
- VectorVest Options Analyzer
- VectorVest ProGraphics v6.0
- VectorVest ProTrader 7
- VectorVest RealTime Derby Tool
- VectorVest Simulator
- VectorVest Variator
- VectorVest Watchdog


