HOT TOPICS LIST
- Strategies
- Stocks
- Buy
- Investing
- Brokers
- Psychology
- Interviews
- Accumulate
- Sell
- Hold
- Spotlight
- Websites
- Candlestick Corner
- Gold & Metals
- Options Trading
LIST OF TOPICS
INVESTING
Why Are Stocks And Bonds Inversely Correlated?
06/16/04 05:03:51 PM PSTby Michael Carr, CMT
Here's some insight into the ongoing battle between the two tradables.
| When interest rates go down, stocks go up, but rising rates are bad for stocks. Everyone knows that. The popular reasoning given by talking heads and newspaper analysts is that bonds and stocks are alternative investments, and rational investors will seek out the asset class with the highest potential return. Sounds logical, right?
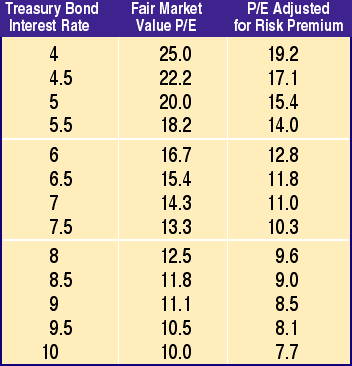
Intermarket relationshipsThe key to understanding the intermarket relationship between stocks and bonds lies in studying the earnings yield. Investors generally look at the price/earnings ratio, which divides price by earnings per share, to determine how many dollars it costs to buy a dollar of earnings. The earnings yield is the inverse of that calculation, multiplied by 100 to express the result as a percentage. By dividing earnings per share by the price, an investor can determine the rate the market is willing to pay for those earnings. In this way, equities yields become directly comparable to bonds yields. For example, if a stock earns $1.00 per share and sells for $20, the P/E ratio is 20 and the earnings yield is 5%. This can be compared to the risk-free rate of return available from Treasury bonds. As of mid-June 2004, the 10-year Treasury is yielding about 4.75%. The interest payments received by bondholders remains fixed for the life of the bond. Assuming a 10-year holding period, the investor can expect to receive total interest payments of $4,750 and a return of $10,000 in principal upon maturity. If earnings per share increase by 10% per year, at the end of 10 years, $1.00 in earnings will have grown to $2.59 per share. Without any change in the P/E ratio, a stock that originally sold for $20 will now sell for $51.80. Assuming a $10,000 initial investment and a 10-year holding period, an investment in this stock will grow to $25,900, returning more than three times as much money to the investor as a bond. Unfortunately, the choice between bonds and stocks is not as clear-cut as this simplified example illustrates. Earnings per share are not guaranteed, while the interest payments on Treasuries are. Future inflation is unknowable, and there is no way to be certain that interest rates with regard to bonds will remain unchanged over 10 years. If inflation is greater than the market expects, that $475 per year in interest payments will buy less in the future. In terms of buying power, the bondholder could actually experience a loss. Uncertainty also affects the stock market. Rational stock market investors expect their total returns to compensate for this uncertainty. Variability of future earnings leads to a risk premium for equities. The risk premium is the difference between the expected return on a stock investment and the risk-free rate of return available from Treasury bonds. To illustrate this concept, Figure 1 shows a fair market value P/E for selected interest rates and the P/E ratio adjusted for a risk premium. The fair market value P/E is calculated by treating the interest rate as an earnings yield.
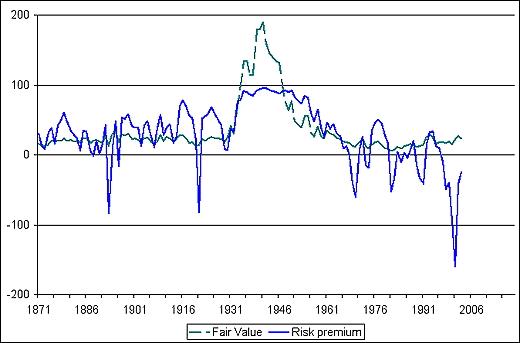
Figure 1: Relationship between interest rates and P/Es. As interest rates increase, P/E ratios should decrease. To adjust for risk, the historical risk premium is calculated. Over more than 130 years of market data, the actual P/E has significantly deviated from the predicted fair market value. The actual risk premium can never be known, and in fact has shown a great deal of variability. Stocks have traded from as much as a 95% discount to the fair value in 1941 to a 160% premium of that value in 2001. Figure 2 illustrates the high degree of variability in the risk premium. The average value of a 30% discount from fair value was used to define the risk premium. The risk-adjusted P/E ratio in Figure 1 is the reciprocal of the interest rate, multiplied by 1.3 to account for the average historical risk premium.
Figure 2: Calculated risk premium (%) and calculated fair market value P/E. Note the high degree of variability in risk premium.
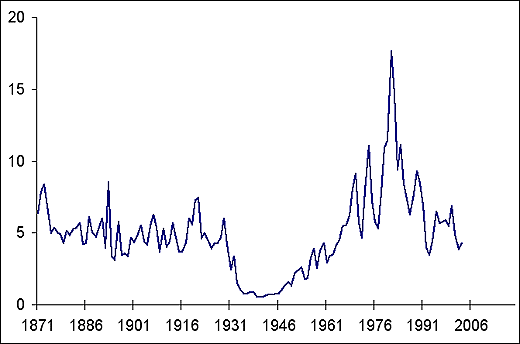
Figure 1 clearly shows that as interest rates increase, P/E ratios should decrease. But this does not mean that stocks must decline. Rising interest rates are driven by a rising demand for money in the economy. The improving economy affects not only interest rates, but also earnings per share. The rising demand for money is chasing manufactured goods and services provided by companies whose stocks are being bought and sold by investors. Increased demand for these products should lead to increased earnings per share, as companies deplete their inventories and benefit from increased prices before having to pay increased wages to their employees. If earnings increase faster than P/Es contract, stocks should rise. And in fact, stocks have risen an average of 9.9% in the first year after the Federal Reserve begins raising rates. Examining stock market data since 1871, we find an average year-over-year earnings per share gain of 6%. Secular, or very long-term, moves in interest rates typically last for decades (Figure 3). Historical interest rate bottoms were reached in 1898 and 1946. In the year following those bottoms, earnings rose dramatically (37% in 1899 and 52% in 1947). In the five-year periods following these bottoms, the average earnings gain per year was 10% from 1899 to 1903 and 21% from 1947 to 1951. Both these averages significantly exceeded the average of 6.5% in any consecutive five-year period.
Figure 3: Long-term interest rates. Secular moves in interest rates usually last for decades.
Eventually, higher rates dampen consumer and capital spending, causing earnings per share to level off and then decline. Higher rates also lead to a lower fair market value P/E ratio, and both factors combine to push stock prices lower. Finally, an interest rate cut is anticipated into the market's forecasting mechanism and a bottom in stocks is reached.
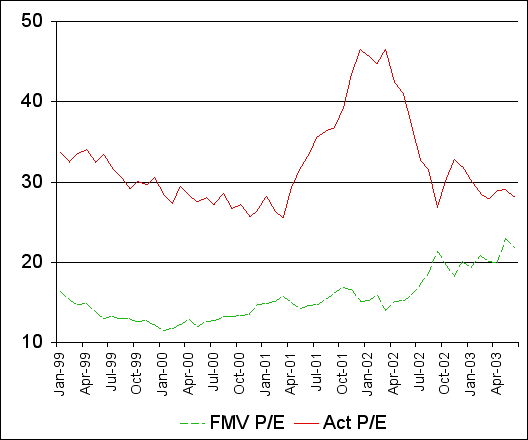
And the answer is . . .Stocks and bonds are usually inversely correlated because of the relationship between earnings yields and interest rates. As interest rates increase, earnings yields must also increase to attract investor demand. The increase in earnings yields may result from a decrease in the price of stocks or an increase in the earnings per share. Depending upon where the economy is in the business cycle, either may dominate for an extended period. At times, the inverse correlation between stocks and bonds may seem to fail; stocks may fall as interest rates decline, or they may rise along with interest rates. At these times, the relationship is best understood by realizing that stocks are moving toward fair value. This was the case following the Internet stock bubble in 2000, when stocks reached unprecedented extremes of overvaluation. Even as rates declined, moving the fair market value P/E higher, actual P/E ratios had to contract toward this fair value. Figure 4 shows this relationship for the year preceding the top until the summer of 2003, after an intermediate-term bottom had been established. Awareness of the earnings yield and the risk premium will allow investors to anticipate secular trends in stocks.
Figure 4: Composition of actual and calculated P/E ratios. Following the Internet bubble of 2000, stocks reached extremely high values. Even though rates declined, actual P/E ratios had to contract toward the fair value.
Michael Carr is a chartered market technician and editor of "Technically Speaking," the newsletter of the Market Technicians Association (www.mta.org). He may be reached at market.strategist@wyowbi.com.
Suggested readingRobert J. Shiller. "Information Site for Irrational Exuberance," http://www.econ.yale.edu/~shiller/data/ie_data.htm.
Current and past articles from Working Money, The Investors' Magazine, can be found at Working-Money.com.
|
Mike Carr is a member of the Market Technicians Association and editor of the MTA's newsletter, Technically Speaking. He is a full-time trader and writer.
| E-mail address: | mcarr@dunnwarren.com |
PRINT THIS ARTICLE

|

Request Information From Our Sponsors
- StockCharts.com, Inc.
- Candle Patterns
- Candlestick Charting Explained
- Intermarket Technical Analysis
- John Murphy on Chart Analysis
- John Murphy's Chart Pattern Recognition
- John Murphy's Market Message
- MurphyExplainsMarketAnalysis-Intermarket Analysis
- MurphyExplainsMarketAnalysis-Visual Analysis
- StockCharts.com
- Technical Analysis of the Financial Markets
- The Visual Investor
- VectorVest, Inc.
- Executive Premier Workshop
- One-Day Options Course
- OptionsPro
- Retirement Income Workshop
- Sure-Fire Trading Systems (VectorVest, Inc.)
- Trading as a Business Workshop
- VectorVest 7 EOD
- VectorVest 7 RealTime/IntraDay
- VectorVest AutoTester
- VectorVest Educational Services
- VectorVest OnLine
- VectorVest Options Analyzer
- VectorVest ProGraphics v6.0
- VectorVest ProTrader 7
- VectorVest RealTime Derby Tool
- VectorVest Simulator
- VectorVest Variator
- VectorVest Watchdog


