HOT TOPICS LIST
- Strategies
- Stocks
- Buy
- Investing
- Brokers
- Psychology
- Interviews
- Accumulate
- Sell
- Hold
- Spotlight
- Websites
- Candlestick Corner
- Gold & Metals
- Options Trading
LIST OF TOPICS
CANDLESTICK CORNER
The Harami: A Strong Reversal Signal
07/08/04 03:54:06 PM PSTby Stephen W. Bigalow
Looking for a better indication that the trend is going to reverse? Here's a pattern that can help.
| There are approximately 50 to 60 signals in the candlestick universe. It can be difficult to try to learn all of them, but you can master candlestick analysis easily by learning just the 10 or so major signals. Knowing these signals and understanding how they are formed will provide you with tremendous insight into investor sentiment at reversal areas in a trend. The ability to identify the major signals and understand the investor sentiment that created them will allow you to project market reversals with a high degree of accuracy. One of these major candlestick signals is called the harami.
The harami patternThe bullish harami is a two-candle pattern. The first formation is usually a large black candle appearing at the end of a downtrend. But how do you know the downtrend has ended? The end of a downtrend can be signaled by other indicators, such as stochastics or moving average convergence/divergence (MACD). The bullish harami is formed by a second candle that opens above the previous day's close and closes below the previous day's open. The word harami means "pregnant" in Japanese, which is why the harami is represented by a large candlestick followed by a second, smaller one (Figure 1).
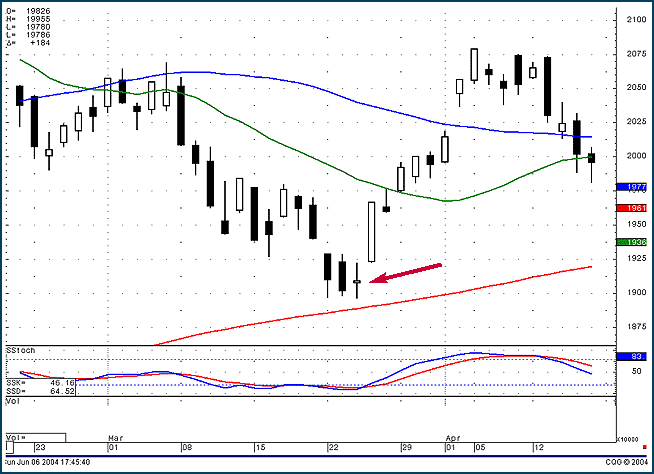
Figure 1: The bullish harami. This pattern is formed by the second candle opening above the previous day's close and closing below the previous day's open. A harami at an important support level, as seen in the Nasdaq chart in Figure 2, is more effective when the second, smaller candlestick is a doji (a candlestick with no, or a very small, body). Once the Nasdaq approached the 200-day moving average, a gap up the day after the doji/harami indicated there was a high probability that the trend might reverse.
Figure 2: Support level. When the harami appeared close to the 200-day moving average, it was followed by a strong trend reversal.
Longer candles in the harami pattern indicate a stronger reversal. In addition, regardless of its length, the higher the white candle's close compared to the black candle, the stronger the evidence of a reversal.
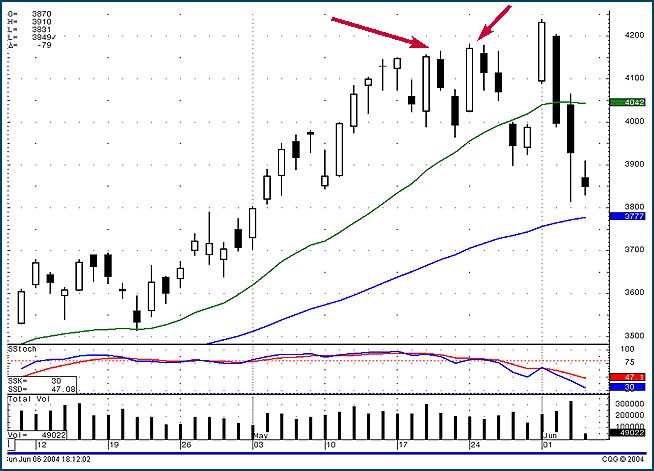
Pattern psychologySuppose that there is a day of strong selling in a clear downtrend. The next day, the price opens with a gap up. Traders who are short begin covering, and the price finishes positive for the day, often with high volume. This creates enough support that short sellers note a violation of the trend. Another strong day would confirm the reversal. The formation of a harami suggests that selling has stopped, which may mean the trend will reverse. The harami provides an excellent indication of how strong the new trend will be. For example, if the second, smaller body of a harami opens and closes at the low end of the previous day's black candle, the trajectory of the new uptrend may be very flat or slow. If the harami closes midway into the previous black candle, the upward trend will be moderately strong. If the harami closes near the top of the previous day's black candle, the new uptrend may be very strong. In this way, a harami can act as a barometer for the buying sentiment in the new uptrend. A harami may be more significant if it appears at a significant technical level, such as a trendline or a moving average line. For example, a harami that forms on an oversold condition is much more significant if it is also located on a 50-day moving average or a 200-day moving average. The candlestick signal creates an immediate buy point, whereas other technical analysis may need additional time to confirm. Thus, the candlestick analyst can profit immediately. The bearish harami is the exact opposite of the bullish harami. After an uptrend and when the stochastics are in the overbought area, look for one last white candle. If the following day opens below the previous day's close and closes above the previous day's open, this will form a black candle "inside" the previous day's white candle. Essentially, this pattern signals that the buying has stopped. This will be confirmed if the next day opens weaker. Note the bearish haramis in the daily chart of crude oil in Figure 3. In late May 2004, the experts were projecting that oil prices could go to $60 per barrel. This analysis was prompted by crude oil going above $40 a barrel for the first time in decades. However, every time the price pushed above the $40 per barrel price, harami formations revealed that the sellers were stepping in. Does this tell you what the smart money was doing? You do not need an extensive research team to delve into what is happening in each industry, stock, or commodity. Candlestick signals will tell you the actual investor sentiment.
Figure 3: Bearish haramis. The appearance of bearish haramis at the $42 level indicates that sellers were stepping in.
Just like the bullish harami, the bearish harami will indicate the magnitude of the new downtrend by where it closes with respect to the previous day's candle. A very small candle at the top end of the previous day's white candle would indicate a very slow downtrend, whereas the close at the lower end of the previous day's white candle would indicate that the selling pressure is going to be much stronger. Understanding what the harami pattern represents will increase your opportunity to profit from its signals. From the days of the first Japanese rice traders to the modern markets centuries later, candlestick signals have established their statistical usefulness. Use the information they provide to your advantage.
Steve Bigalow is the author of Profitable Candlestick Trading and the principal of www.candlestickforum.com, a website for educating investors in the use of candlesticks.
Suggested readingBigalow, Stephen W. [2002]. Profitable Candlestick Trading, John Wiley & Sons.
Charts courtesy CQG
Current and past articles from Working Money, The Investors' Magazine, can be found at Working-Money.com.
|
Stephen W. Bigalow is an author and the principal of the www.candlestickforum.com, a website for providing information and educational material about candlestick investing.
| Website: | www.candlestickforum.com |
| E-mail address: | sbigalow@msn.com |
PRINT THIS ARTICLE

|

Request Information From Our Sponsors
- StockCharts.com, Inc.
- Candle Patterns
- Candlestick Charting Explained
- Intermarket Technical Analysis
- John Murphy on Chart Analysis
- John Murphy's Chart Pattern Recognition
- John Murphy's Market Message
- MurphyExplainsMarketAnalysis-Intermarket Analysis
- MurphyExplainsMarketAnalysis-Visual Analysis
- StockCharts.com
- Technical Analysis of the Financial Markets
- The Visual Investor
- VectorVest, Inc.
- Executive Premier Workshop
- One-Day Options Course
- OptionsPro
- Retirement Income Workshop
- Sure-Fire Trading Systems (VectorVest, Inc.)
- Trading as a Business Workshop
- VectorVest 7 EOD
- VectorVest 7 RealTime/IntraDay
- VectorVest AutoTester
- VectorVest Educational Services
- VectorVest OnLine
- VectorVest Options Analyzer
- VectorVest ProGraphics v6.0
- VectorVest ProTrader 7
- VectorVest RealTime Derby Tool
- VectorVest Simulator
- VectorVest Variator
- VectorVest Watchdog


