HOT TOPICS LIST
- Strategies
- Stocks
- Buy
- Investing
- Brokers
- Psychology
- Interviews
- Accumulate
- Sell
- Hold
- Spotlight
- Websites
- Candlestick Corner
- Gold & Metals
- Options Trading
LIST OF TOPICS
The Presidential Leap
07/07/04 04:18:18 PM PSTby Matt Blackman
Every four years, we get an extra day to do with as we please. It's the same year when incumbent US Presidents throw open the floodgates on spending and print money like there's no tomorrow. Here's what it all means for the market.
| If you were born on February 29, 1952, technically, you would have celebrated your 13th birthday in 2004. That's because 1952 was a leap year; it's only once every four years that there is a 29th day in February. (DC Comics, the home of Superman, will tell you that super-hero was born on a leap year. But that's neither here nor there.) But 1952 was also an election year in the US, as has been every leap year in recent memory, and the significance of the election is far greater for the economy and the markets than is the gift of an extra day. During election years, incumbent Presidential administrations do everything they can to put voters in the best possible mood before going to the polls in November. Here is how Yale and Jeffrey Hirsch explain the election year phenomenon in The Stock Trader's Almanac 2004:
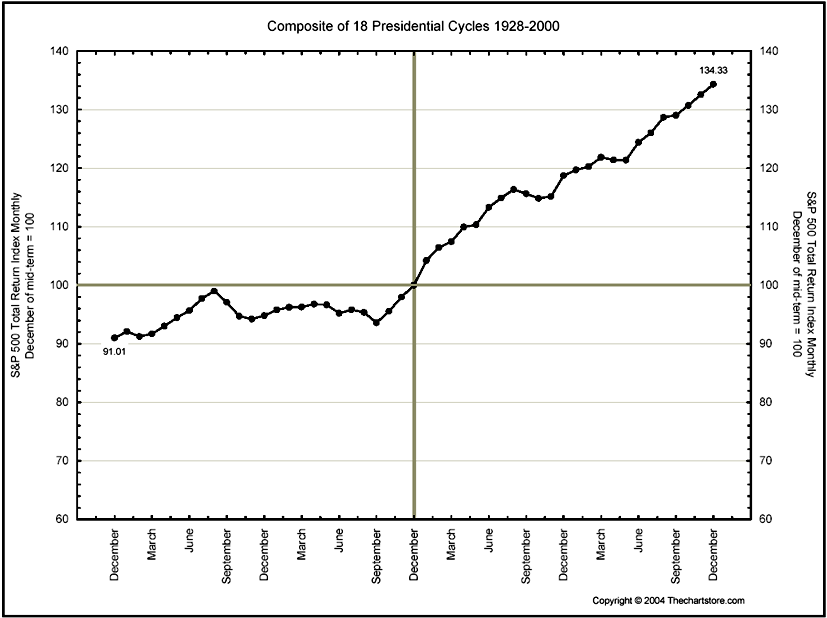
How the government manipulates the economy to stay in power: the "making of Presidents" is accomplished through an unsubtle manipulation of the economy. Stimulative fiscal measures designed to increase per capita disposable income, providing a sense of well-being to the voting public [including] increases in the federal budget deficits; government spending and social security benefits; interest rate reductions on government loans [which help depress general interest rates]; and speed-ups of projected funding The Almanac also presents some very interesting findings from a book published by Edward R. Tufte in 1978 entitled Political Control Of The Economy. It puts forth convincing evidence such as a 29% increase in federal spending during the election years between 1962 and 1973, 100% higher increases in Social Security during election years versus nonelection years from 1952 to 1974, and accelerations in real disposable income in all but one election year between 1947 and 1973 through a variety of tactics including tax cuts and related fiscal measures. According to the charts of both the Dow Jones Industrial Average (DJIA) and the Standard & Poor's 500 index (Figure 1), these tactics also appear to have had a profound effect on the markets.
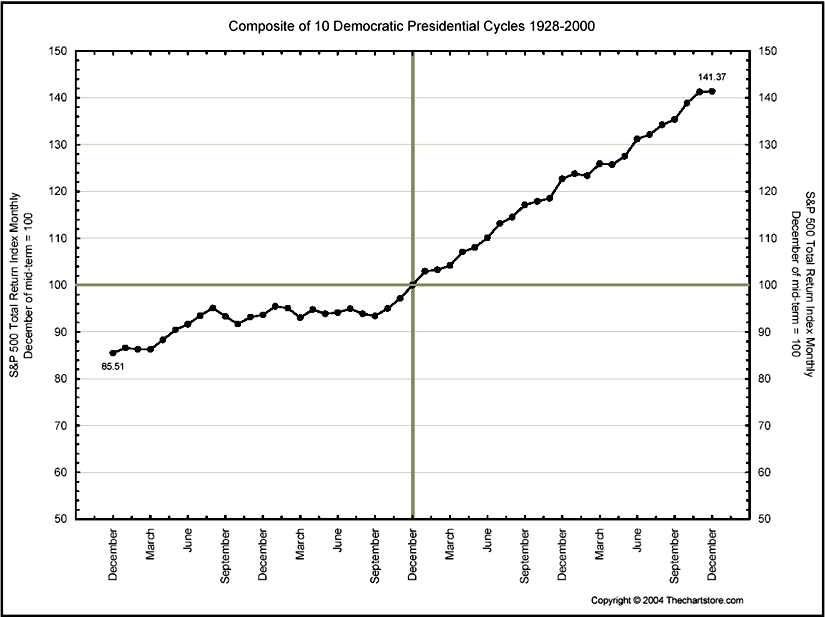
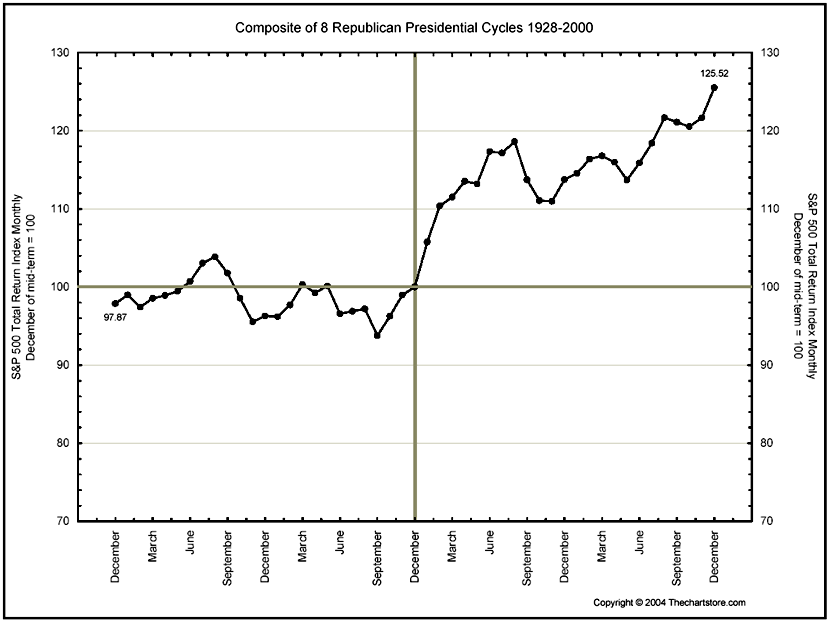
Figure 1: Composite chart of 18 Presidential cycles, 1928-2000, for the S&P 500 Index. The cycle that ends with a bang Both Republican and Democratic Presidential administrations are equally guilty of this unsubtle manipulation in the final year of the four-year Presidential cycle, although the charts appear to indicate that Democrats have been more effective than rival Republicans. Does this mean they are more successful in running the economy, or simply more shameless in their spending? To answer that question, it would be necessary to build a composite chart of the years following a Democratic President, which is beyond the scope of this article. However, it is important to understand the difference when developing a trading strategy. During the final year of the average Republican Presidency, the S&P 500 appreciated an average 14%. The S&P gained an average of nearly 20% during the last year of Democratic Presidencies (see Figures 2 and 3). From midterm to election, the S&P gained 25.5% during the last half of the average Republican reign, versus more than 41% for Democrats. That's a difference of nearly 50% between the two parties in the last two years in office!
Figure 2: Composite of 10 Democratic Presidential cycles, 1928-2000. Are Democrats better economic overseers in election years than Republicans, or just better manipulators?
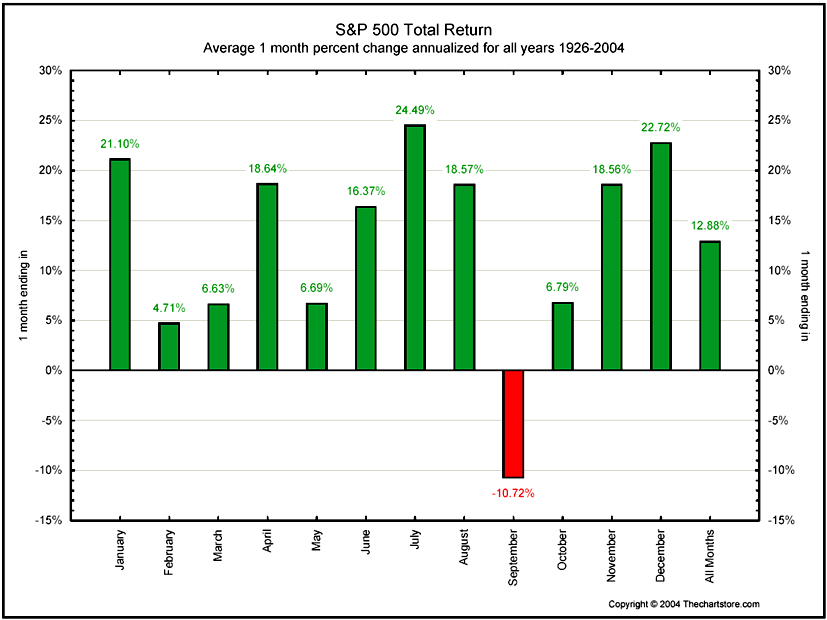
Figure 3: Composite of eight Republican Presidential cycles, 1928-2000. It is also interesting to note that the equity curve is smoother during Democratic governments, but that may be a function of the higher number of datapoints and subsequent lower error factor. What a difference a month makes How did election-year annualized average monthly returns compare to normal years for the S&P 500? In normal years from 1926 through 2000, July was the best month, with an average return of 24.5%. September was the worst month of the year, dropping an average of nearly 11% for the month (see Figure 4).
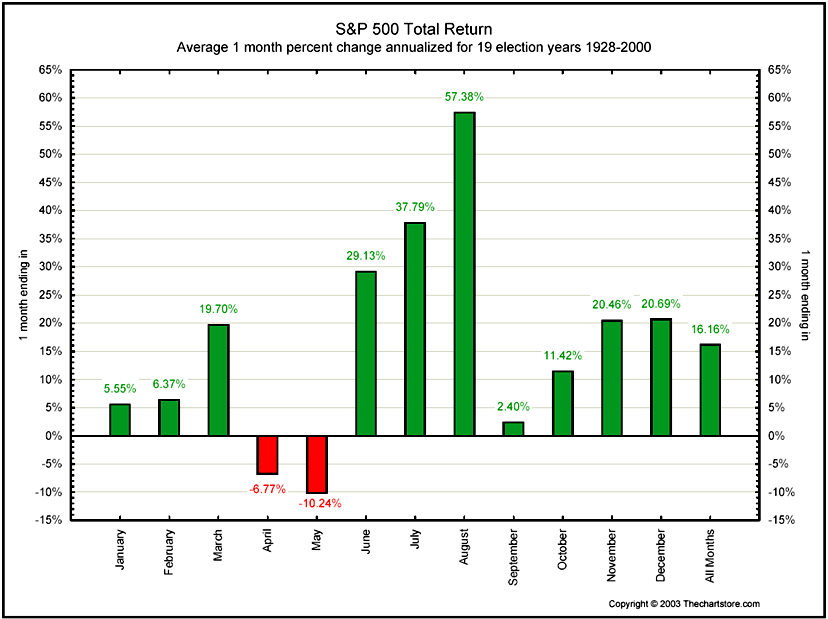
Figure 4: Average one-month S&P 500 percent changes annualized for 1926-2004. In comparison, during 19 election years from 1928 through 2000, the worst periods of the year were April and May, over which the index lost an annualized two-month average of 17% (see Figure 5). The big difference here is that the drop came early during election years as opposed to after the midpoint in normal years.
Figure 5: Average one-month S&P 500 percent changes annualized for 10 election years 1928-2004.
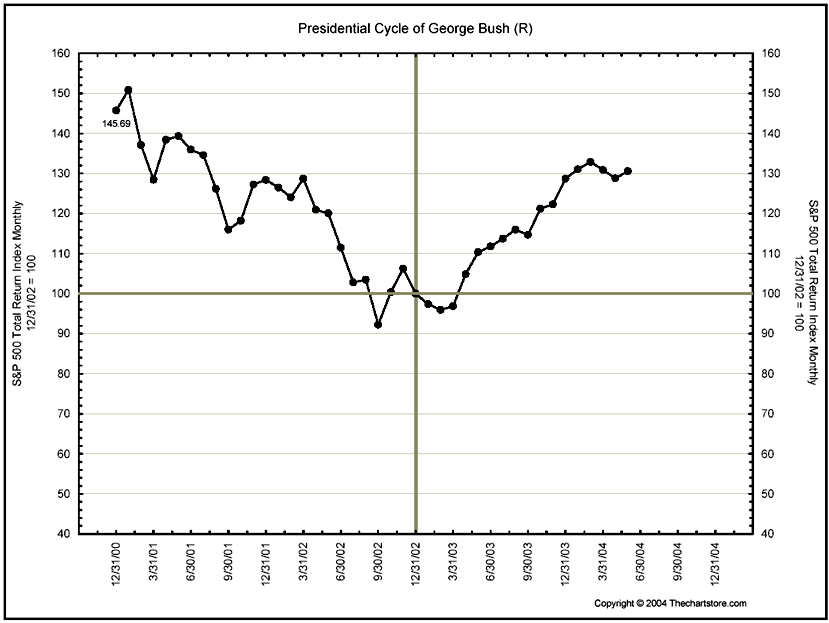
August was the best election-year month, with an average monthly annualized return of 57%. This is more than double the all-year or normal August average of 24.5%. Finally, the average election-year monthly return was 16.2%, compared with 12.88% for all years. Election-year Augusts returned nearly five times the all-year monthly average! July was the second-best election-year month, with an average return of 37.8%, followed by June, which returned an average 29%. It is interesting to note that the best three months in the average election-year outperformed the best normal-year month (July). It follows that June, July, and August of an election year were the best three months of the Presidential cycle, at least when looking at average monthly annualized returns. The best times to be out of the market were April and May. September was the best month to stay away in nonelection years. Last but not least We now know that the last two years of the Presidential cycle are the best times to be in the market, and that statistics show that the upward change is greatest during a Democratic Presidency. Of all the months during the election year, June through August were best followed by December and then November. But before jumping in and making a trade, it is imperative that you look at market performance during each Presidency. In the case of George W. Bush's administration from 2000 to 2004 (Figure 6), the S&P 500 dropped more than 50% in the first two years of his mandate before recovering from midpoint. However, that is less important than the fact that the index had already appreciated more than 30% from midpoint by early June 2004. This compares with an average return of 25.52% in the last two years of a Republican in office. This tells us that the average gains for a Republican Presidency had already occurred. From a statistical standpoint, the chances of the market continuing higher from there were less than the chances of it dropping to end the year at a 25% gain.
Figure 6: Presidential cycle of George W. Bush from 2000 to June 2004.
In the final analysis, looking to capture election-year versus nonelection-year returns should only represent part of an overall trading strategy, and limited to determining an overall macro bias. Other fundamental and technical factors must also be weighed; these will depend on the trader's preferred time in the trade and risk tolerance. Expert traders do not base their final decision on such a narrow set of parameters. Instead, their trading methods are determined by a broader spectrum of data. But one thing is certain: Traders with mid- to longer-term time horizons can ill-afford to ignore the Presidential cycle. It's undeniable that leap years and the final 12 months of a President's term in office hold special promise for those who know when and how to exploit them to their best advantage.
Matt Blackman is a technical trader, author, reviewer, keynote speaker, and regular contributor to a number of trading publications and investment/trading websites in North America and Europe. He is an affiliate Market Technicians Association and Canadian Society of Technical Analysts member and is currently enrolled in the Chartered Market Technicians (CMT) program. He can be reached at matt@tradesystemguru.com or trader@goldhaven.com.
Suggested readingHirsch, Yale, and Jeffrey Hirsch [2004]. The Stock Trader's Almanac 2004, John Wiley & Sons.Tufte, Edward R. [1978]. Political Control Of The Economy, Princeton University Press. More Presidential cycles charts: http://www.thechartstore.com/html/Other Samples.pdf
Charts courtesy www.TheChartStore.com
Current and past articles from Working Money, The Investors' Magazine, can be found at Working-Money.com.
|
Matt Blackman is a full-time technical and financial writer and trader. He produces corporate and financial newsletters, and assists clients in getting published in the mainstream media. He tweets about stocks he is watching at www.twitter.com/RatioTrade Matt has earned the Chartered Market Technician (CMT) designation.
| E-mail address: | indextradermb@gmail.com |
PRINT THIS ARTICLE

Request Information From Our Sponsors
- VectorVest, Inc.
- Executive Premier Workshop
- One-Day Options Course
- OptionsPro
- Retirement Income Workshop
- Sure-Fire Trading Systems (VectorVest, Inc.)
- Trading as a Business Workshop
- VectorVest 7 EOD
- VectorVest 7 RealTime/IntraDay
- VectorVest AutoTester
- VectorVest Educational Services
- VectorVest OnLine
- VectorVest Options Analyzer
- VectorVest ProGraphics v6.0
- VectorVest ProTrader 7
- VectorVest RealTime Derby Tool
- VectorVest Simulator
- VectorVest Variator
- VectorVest Watchdog
- StockCharts.com, Inc.
- Candle Patterns
- Candlestick Charting Explained
- Intermarket Technical Analysis
- John Murphy on Chart Analysis
- John Murphy's Chart Pattern Recognition
- John Murphy's Market Message
- MurphyExplainsMarketAnalysis-Intermarket Analysis
- MurphyExplainsMarketAnalysis-Visual Analysis
- StockCharts.com
- Technical Analysis of the Financial Markets
- The Visual Investor

